Fig. 1
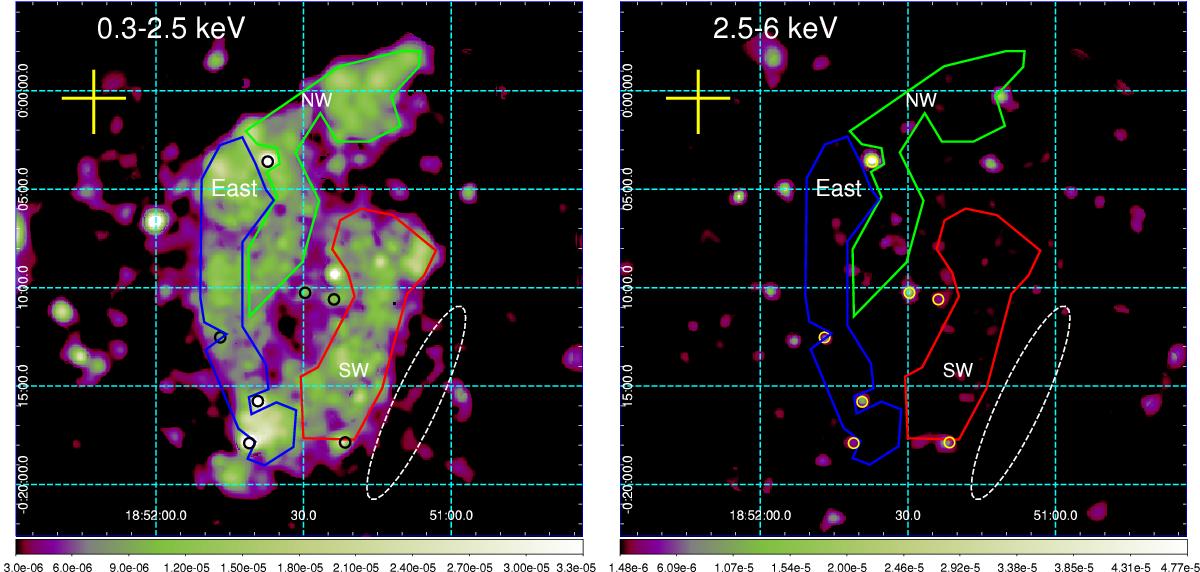
Left panel: EPIC count-rate images (MOS and pn mosaic) of Kes 78 in the 0.3−2.5 keV band (counts per second per 4′′ bin). The image is background subtracted, vignetting corrected, and adaptively smoothed to a signal-to-noise ratio of 16. North is up and east is to the left. Regions East, Northwest, and Southwest (selected for the spatially resolved spectral analysis) are shown in blue, green, and red, respectively. The region selected to extract the background spectrum is indicated with the dashed white ellipse. Hard point-like sources are indicated with black circles. The yellow cross to the northeast shows the centroid of the extended γ-ray source HESS J1852-000 (Kosack et al. 2011). Right panel: same as left panel in the 2.5−6 keV band (with hard point sources shown in yellow).
Current usage metrics show cumulative count of Article Views (full-text article views including HTML views, PDF and ePub downloads, according to the available data) and Abstracts Views on Vision4Press platform.
Data correspond to usage on the plateform after 2015. The current usage metrics is available 48-96 hours after online publication and is updated daily on week days.
Initial download of the metrics may take a while.