Fig. 4
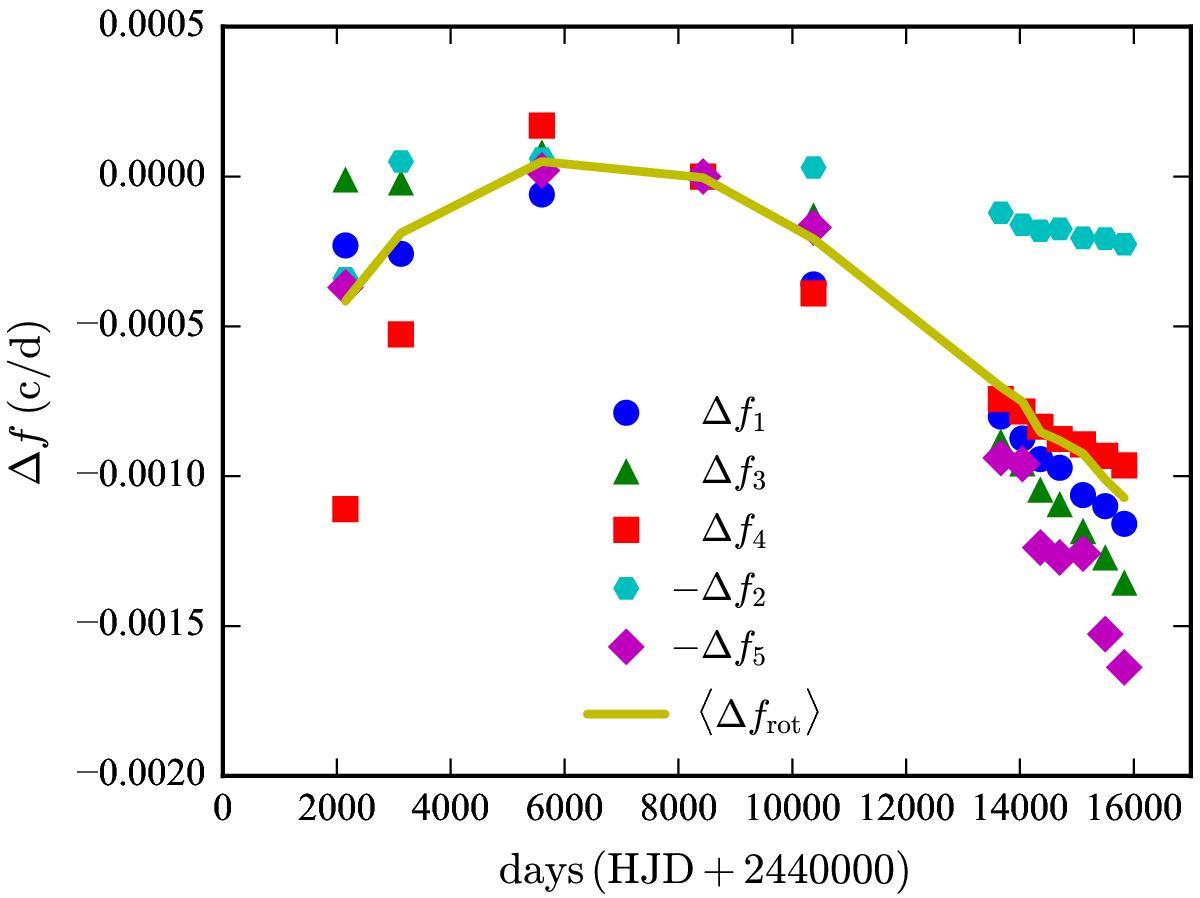
Frequency changes of the different pulsation modes relative to their 1986 values (symbols). As indicated in the legend, we have plotted the negative of the frequency changes for the retrograde modes; the solid curve shows the average of these frequency changes. After accounting for the sign of m, we see that the prograde and retrograde modes contribute morphologically similar frequency changes.
Current usage metrics show cumulative count of Article Views (full-text article views including HTML views, PDF and ePub downloads, according to the available data) and Abstracts Views on Vision4Press platform.
Data correspond to usage on the plateform after 2015. The current usage metrics is available 48-96 hours after online publication and is updated daily on week days.
Initial download of the metrics may take a while.