Fig. 3
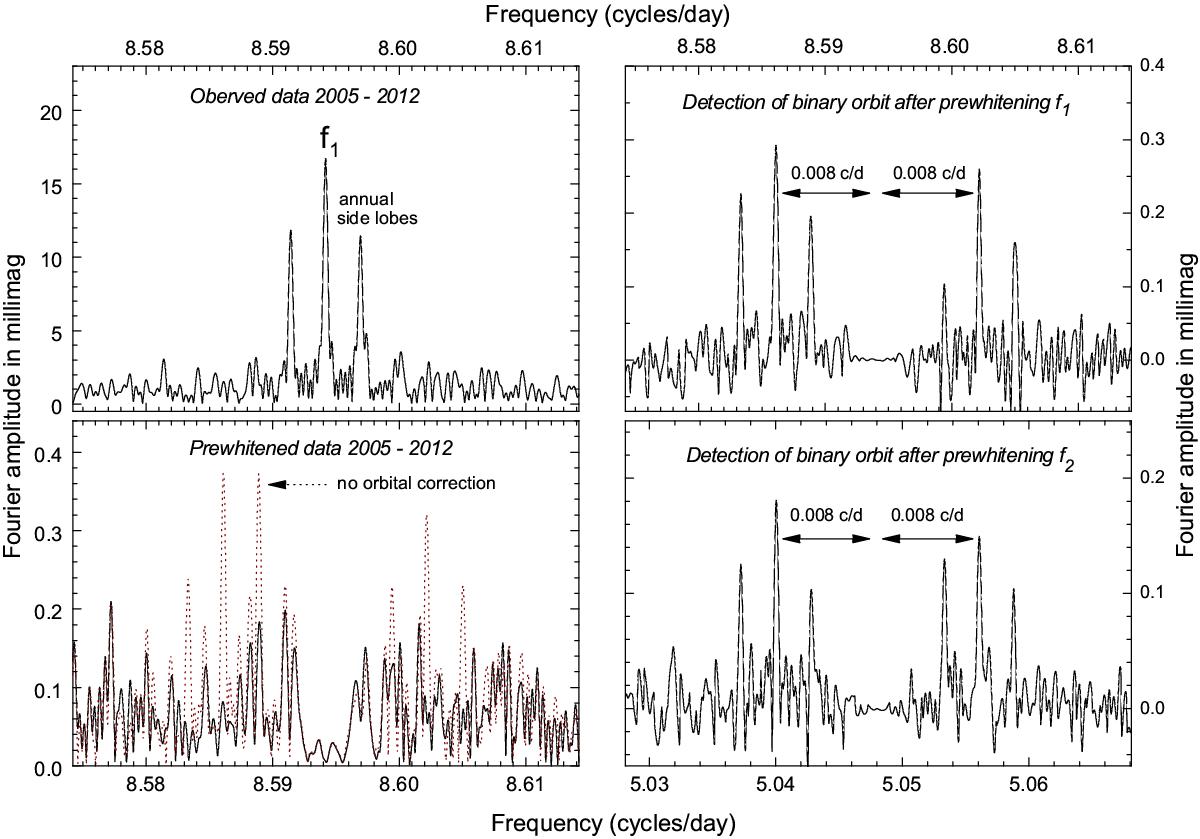
Confirmation of the binary orbit from a comparison of the 2005–2012 photometric data without and with the orbital light-time corrections. Top left panel: Fourier amplitudes of the observed data near the f1 frequency. Bottom left panel: Fourier amplitudes of the residuals after prewhitening the best 64-frequency solutions. Note the changed amplitude scale. The uncorrected data (dotted curve) shows the side peaks from the 124 (~1/ 0.008) d orbit, while the data corrected for the spectroscopically detected binary orbit eliminates these peaks. The difference of the f1 side peaks from the lower left panel is demonstrated in the top right panel. A similar analysis for f2 (bottom right panel) confirms the detection.
Current usage metrics show cumulative count of Article Views (full-text article views including HTML views, PDF and ePub downloads, according to the available data) and Abstracts Views on Vision4Press platform.
Data correspond to usage on the plateform after 2015. The current usage metrics is available 48-96 hours after online publication and is updated daily on week days.
Initial download of the metrics may take a while.