Free Access
Fig. 2
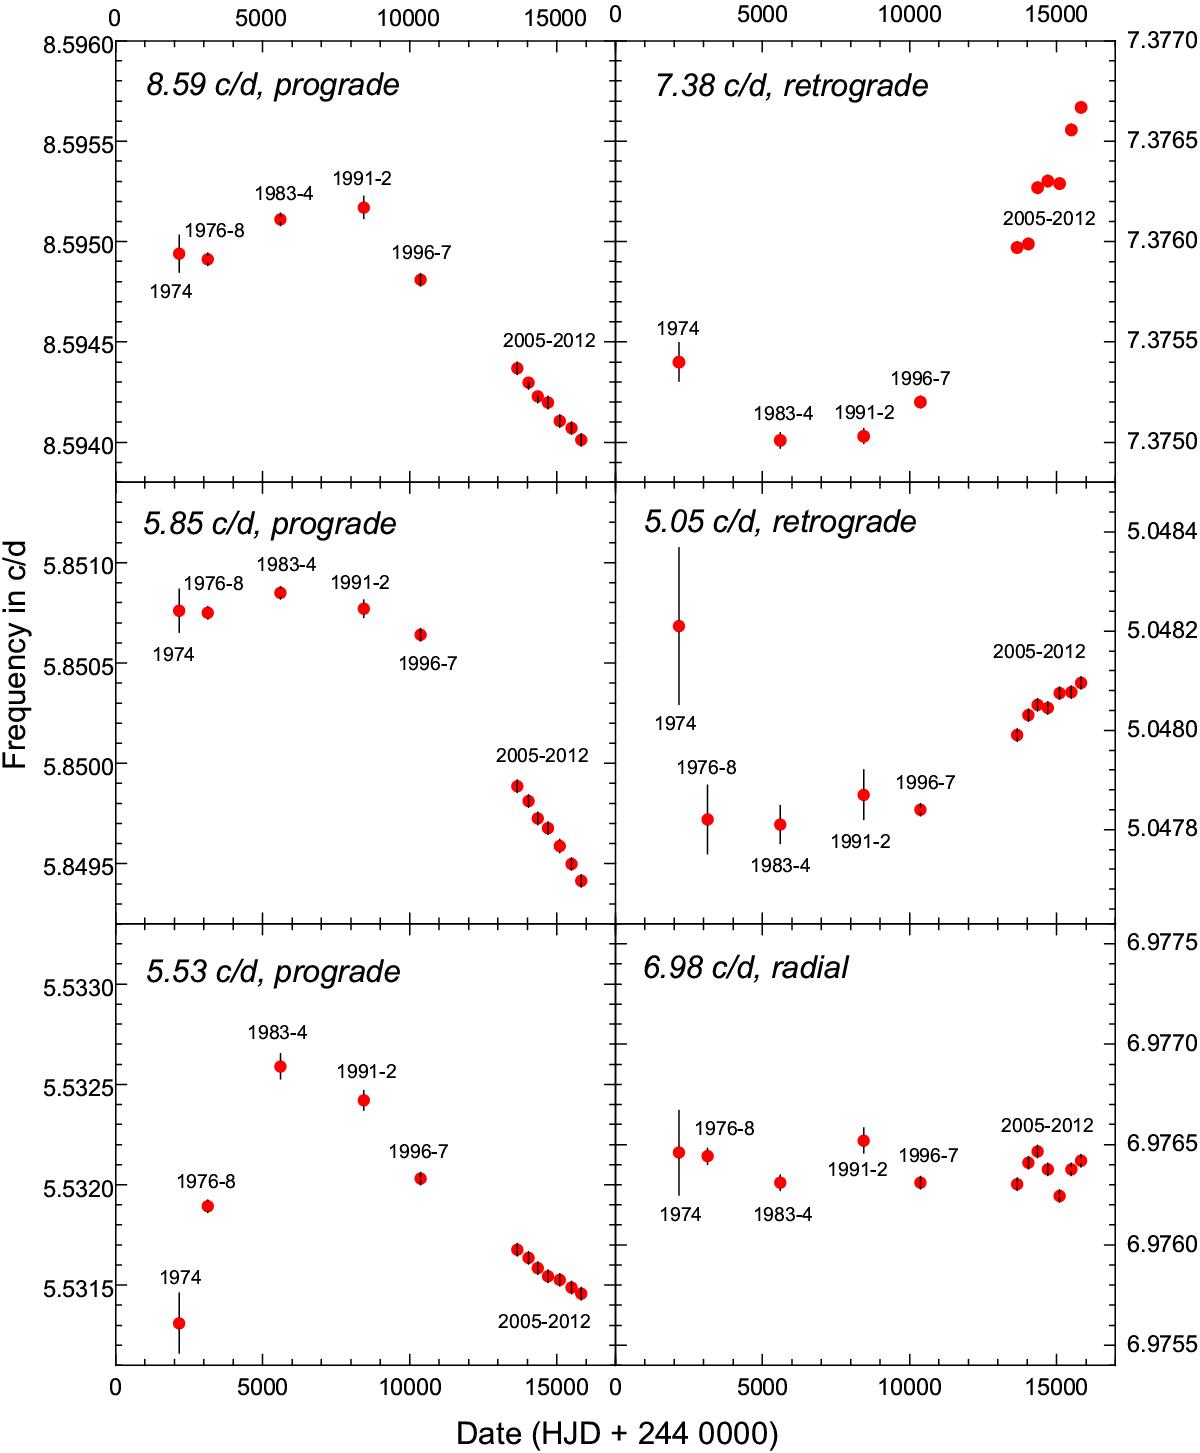
Frequency variations of the six dominant modes from 1974 to 2012. The errors bars shown are usually the size of the symbols. The diagram shows the systematic difference between prograde and retrograde modes. Furthermore, around ~1986 the sign of the frequency changes reversed systematically.
Current usage metrics show cumulative count of Article Views (full-text article views including HTML views, PDF and ePub downloads, according to the available data) and Abstracts Views on Vision4Press platform.
Data correspond to usage on the plateform after 2015. The current usage metrics is available 48-96 hours after online publication and is updated daily on week days.
Initial download of the metrics may take a while.