Fig. 1
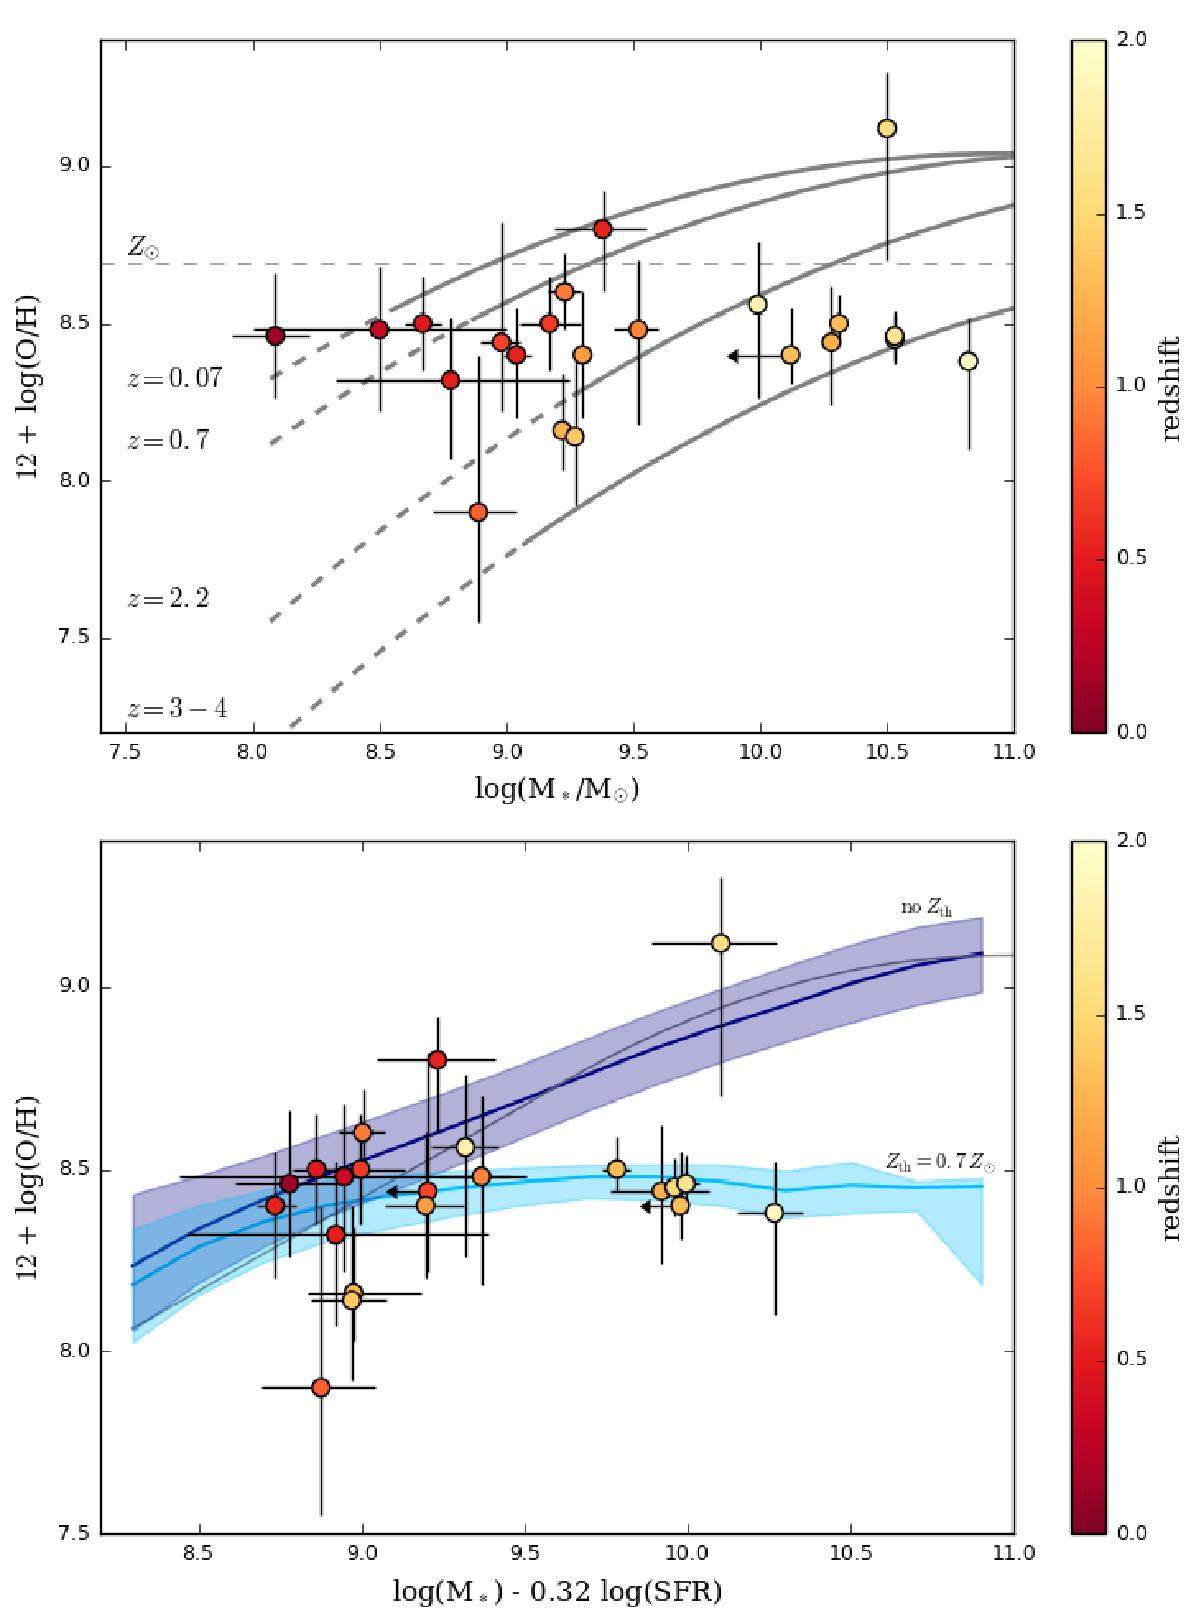
Top panel: MZ plot. The dots correspond to the host galaxies of the Swift/BAT6 sample of LGRBs at z < 2, color coded depending on their redshift as shown in the right bar. The lines correspond to the relations found for field galaxies at the redshift indicated next to each line. Bottom panel: FMR plane. The dots correspond to the host galaxies of the Swift/BAT6 sample of LGRBs at z < 2, color coded depending on their redshift as shown in the right bar. The gray line corresponds to the FMR found by Mannucci et al. (2010, 2011). The dark blue curve and area correspond to FMR relation and of its quartiles obtained using the simulation of Campisi et al. (2011). The cyan curve and area correspond to the best-fit model results.
Current usage metrics show cumulative count of Article Views (full-text article views including HTML views, PDF and ePub downloads, according to the available data) and Abstracts Views on Vision4Press platform.
Data correspond to usage on the plateform after 2015. The current usage metrics is available 48-96 hours after online publication and is updated daily on week days.
Initial download of the metrics may take a while.