Fig. 7
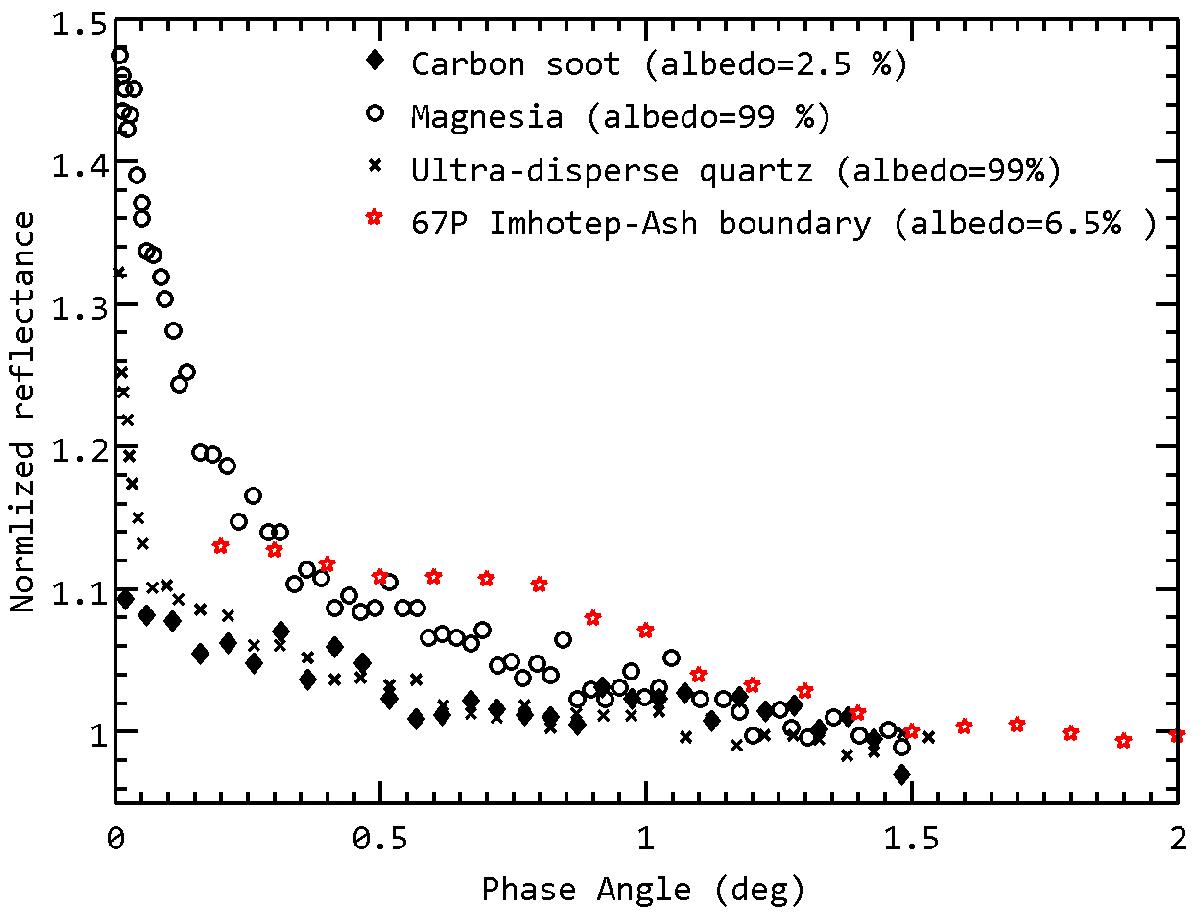
Photometric phase curve for magnesia, carbon soot, and ultra-dispersed quartz measured in the laboratory at the λ = 630 nm in the phase angle range of 0.008°–1.5°. The data points are taken from the figure in Psarev et al. (2007). The intensity is normalized at phase angle 1.5°. The local phase curve constructed from the Imhotep-Ash region of 67P using an OSIRIS close-flyby image in F82 (649 nm) filter is plotted as well (red dots).
Current usage metrics show cumulative count of Article Views (full-text article views including HTML views, PDF and ePub downloads, according to the available data) and Abstracts Views on Vision4Press platform.
Data correspond to usage on the plateform after 2015. The current usage metrics is available 48-96 hours after online publication and is updated daily on week days.
Initial download of the metrics may take a while.