Fig. 5
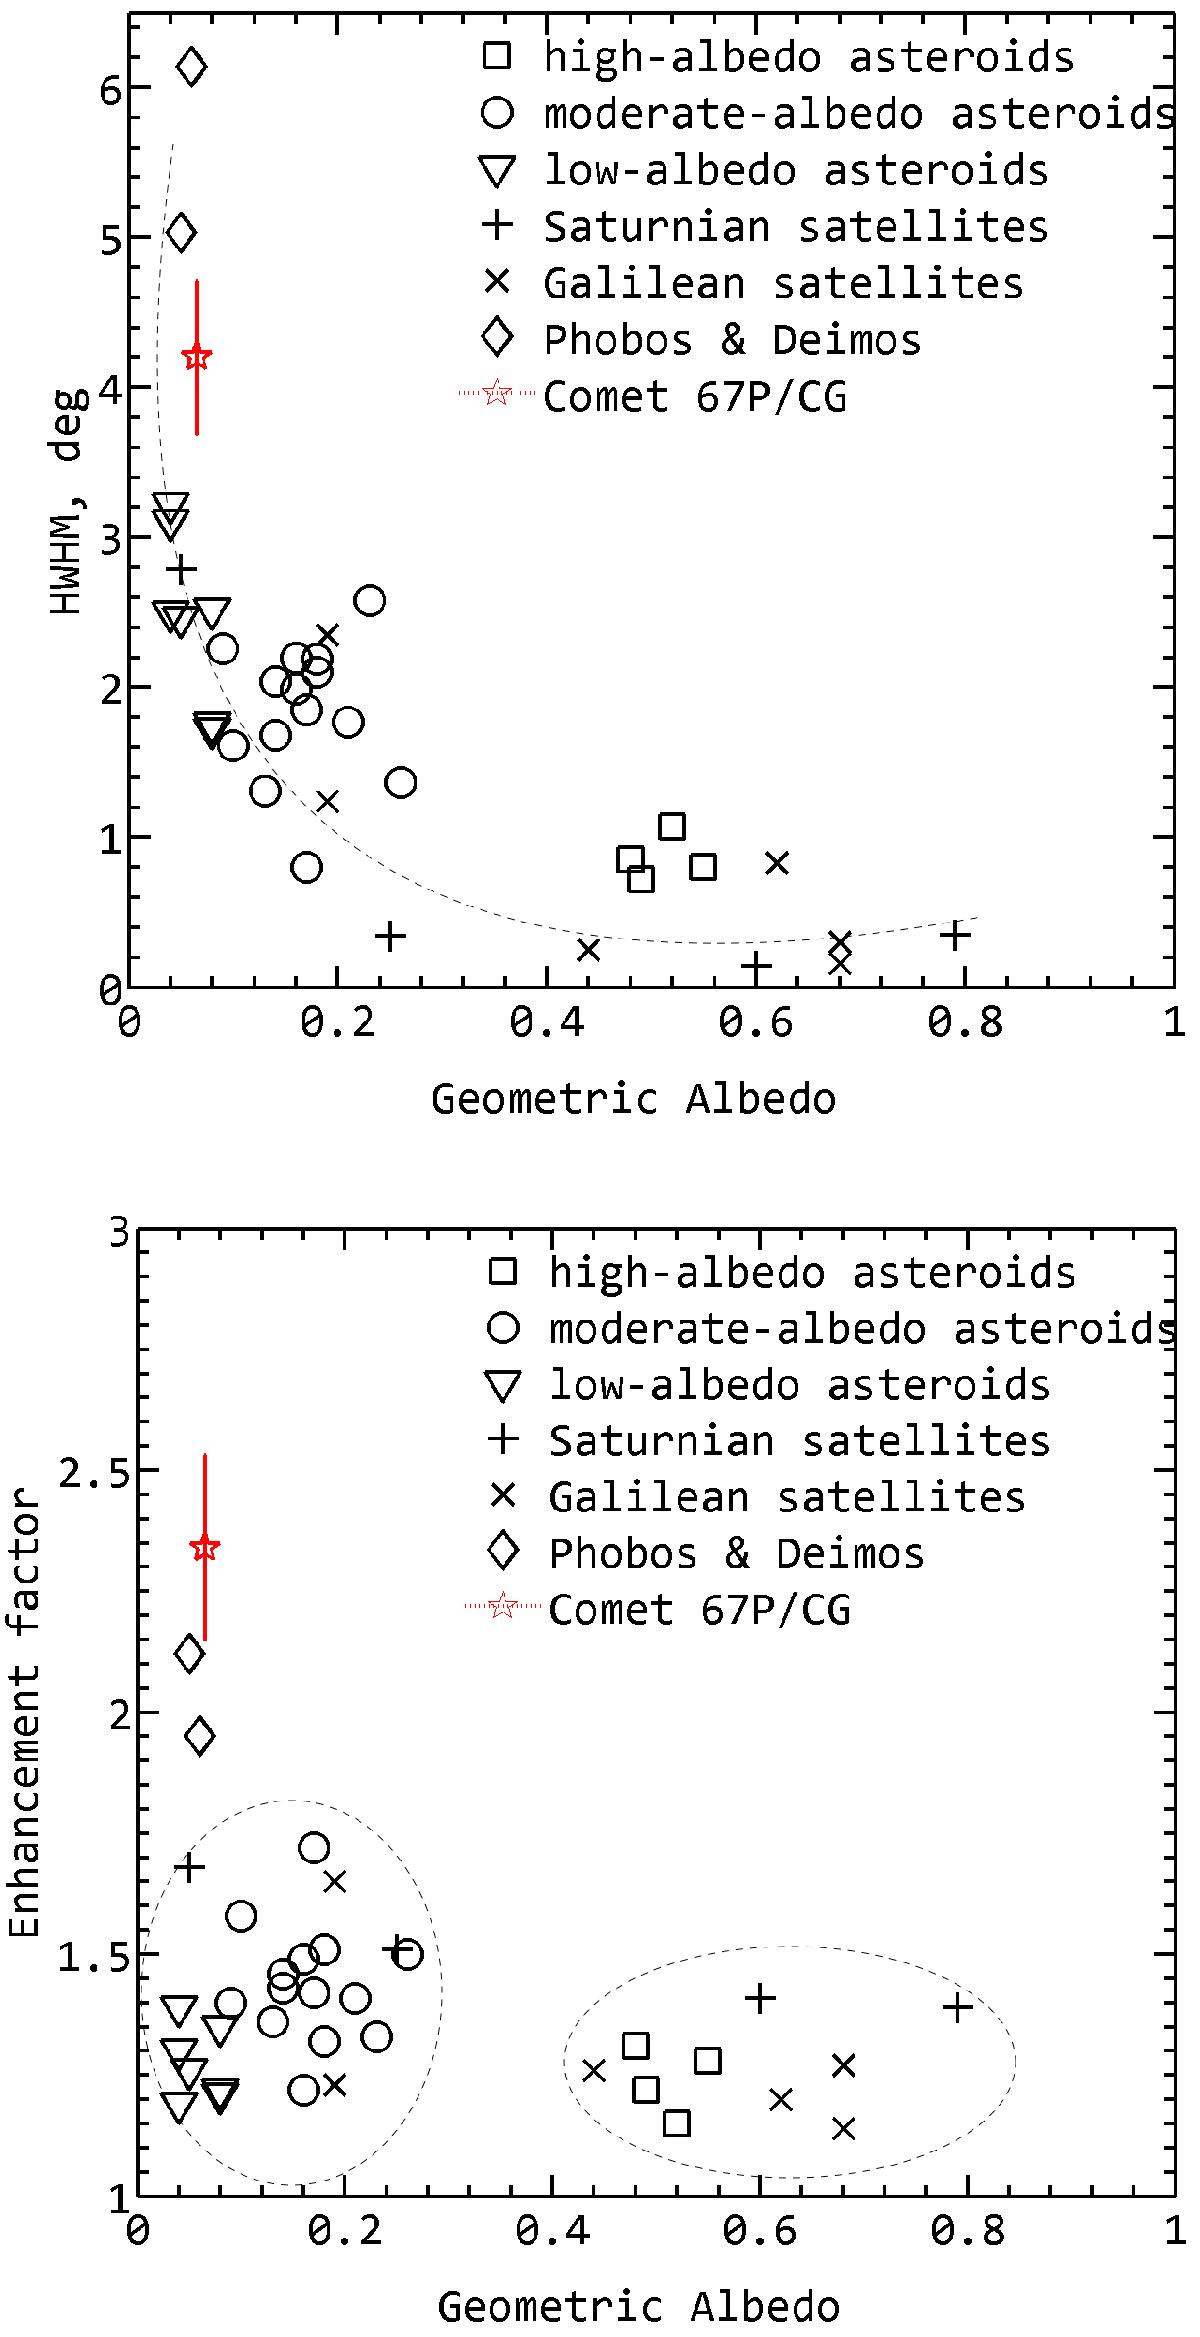
Plots of the HWHM (upper panel) and the enhancement factor (lower panel) versus the geometric albedo of bodies in the solar system, evaluated by Rosenbush et al. (2002). The model OE parameters of 67P are shown by a red star symbol. The error bar is associated with the fit uncertainty. The dashed curve in the upper panel represents the inverse trend by inspection between HWHM and the geometric albedo. The dashed circular curves in the lower panel display two groups of data points with ζ> 1.8 (dark objects) and <1.6 (bright objects).
Current usage metrics show cumulative count of Article Views (full-text article views including HTML views, PDF and ePub downloads, according to the available data) and Abstracts Views on Vision4Press platform.
Data correspond to usage on the plateform after 2015. The current usage metrics is available 48-96 hours after online publication and is updated daily on week days.
Initial download of the metrics may take a while.