Free Access
Fig. 1
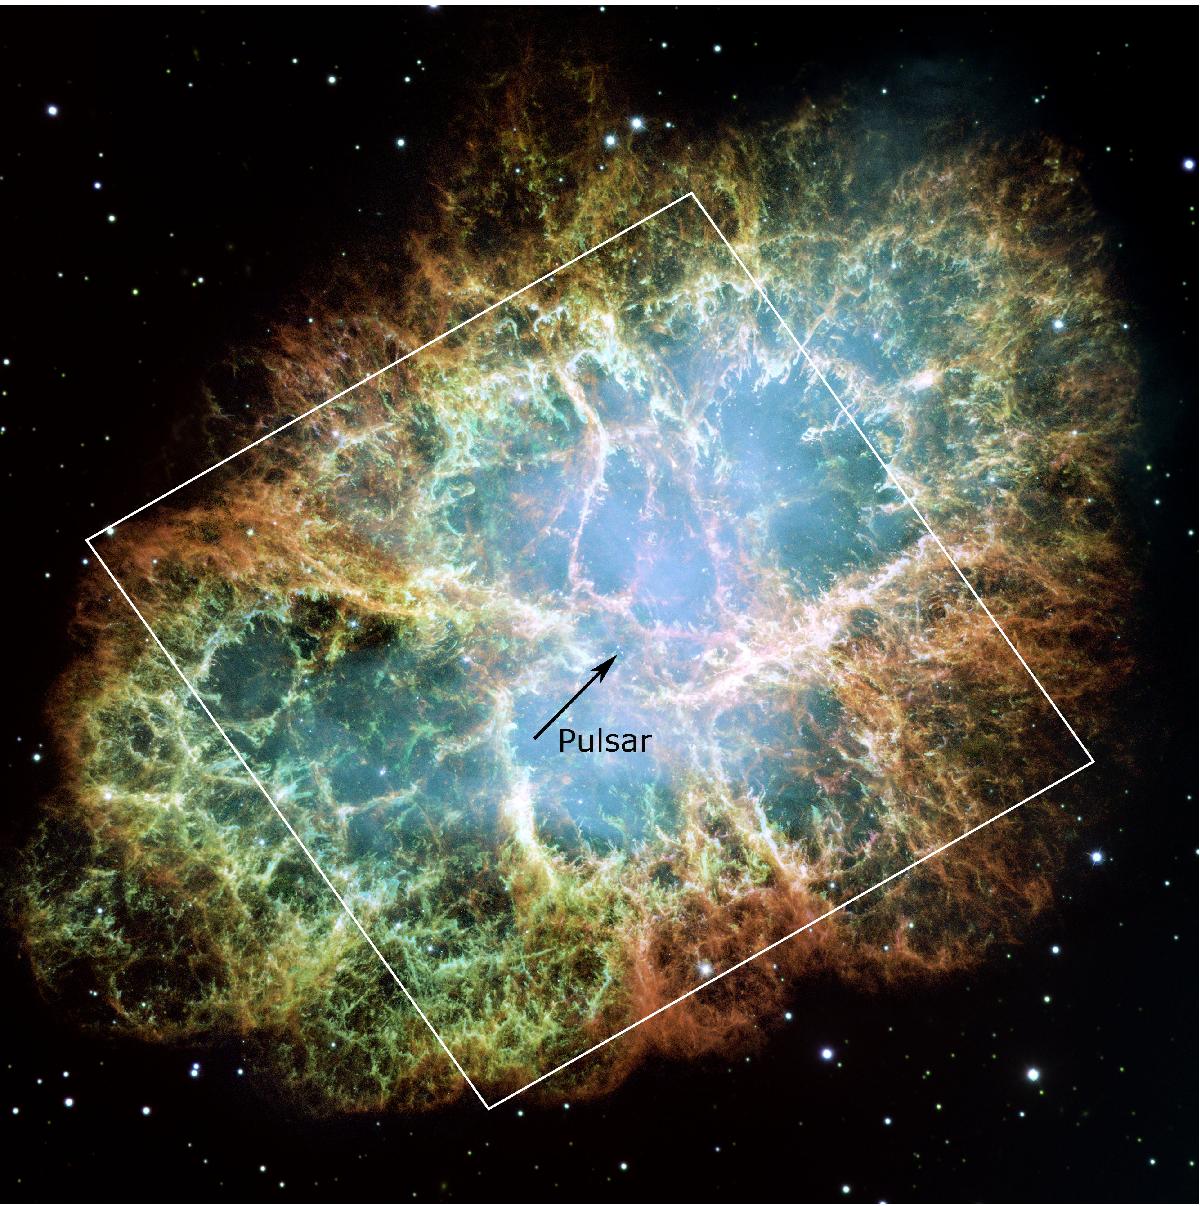
HST color image composed from images in the F502N, F631N, and F673N filters (courtesy: NASA, ESA, and J. Hester, Arizona State University). The area investigated here is marked, and the arrow points to the location of the pulsar (north is up and east left).
Current usage metrics show cumulative count of Article Views (full-text article views including HTML views, PDF and ePub downloads, according to the available data) and Abstracts Views on Vision4Press platform.
Data correspond to usage on the plateform after 2015. The current usage metrics is available 48-96 hours after online publication and is updated daily on week days.
Initial download of the metrics may take a while.