Free Access
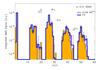
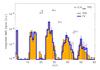
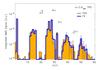
Fig. 7

QMS integrated signal for a-C:H sample irradiated with 132Xe21 + (orange bars) at 300 K (upper panel), during the TPD after 100 K irradiation (center panel) and after 40 K irradiation (lower panel). The best model fits are shown in blue. The labels above mark the positions where residual contaminant gases could contribute.
This figure is made of several images, please see below:
Current usage metrics show cumulative count of Article Views (full-text article views including HTML views, PDF and ePub downloads, according to the available data) and Abstracts Views on Vision4Press platform.
Data correspond to usage on the plateform after 2015. The current usage metrics is available 48-96 hours after online publication and is updated daily on week days.
Initial download of the metrics may take a while.