Fig. 1
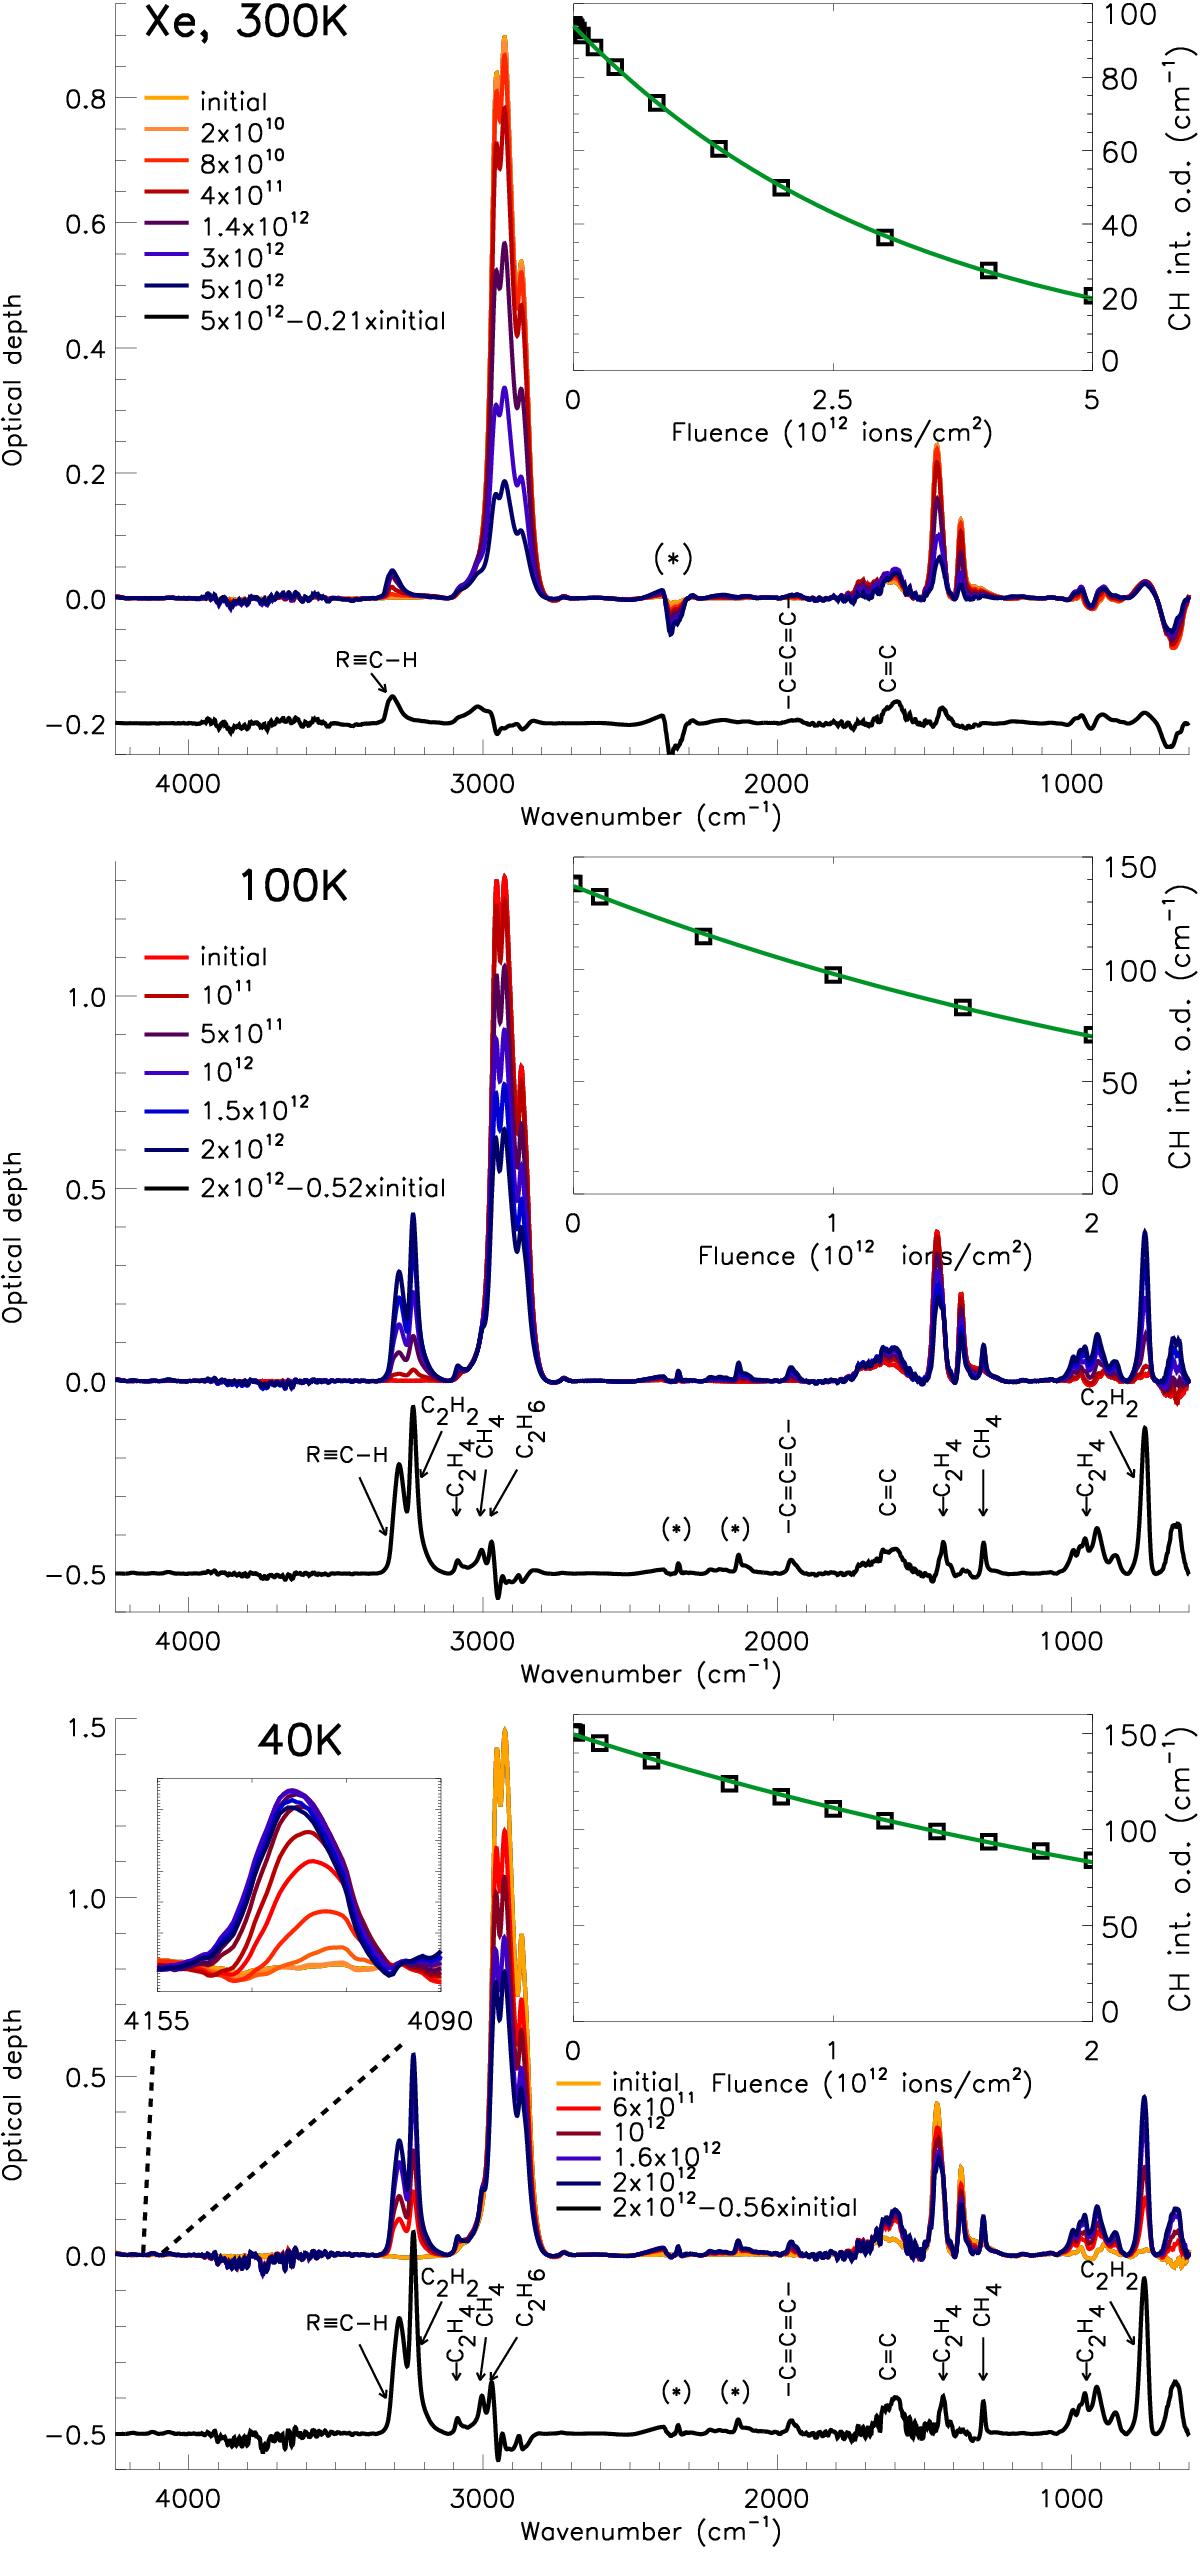
Infrared optical depth spectra of the a-C:H sample, irradiated with 132Xe21 + at 300 K (upper panel), 100 K (center panel), and 40 K (lower panel), as a function of fluence. The lower spectrum in each panel is the difference between the spectrum recorded at the highest fluence and the pristine material scaled to the CH stretching mode intensity to show the newly formed bonds in the material with a higher contrast. The upper right insets show the integrated optical depth for the CH bonds (squares) as a function of fluence. The lines are exponential fits that allow us to determine the destruction cross section (see text for details). At 40 K the inset shows the appearance of a band around 4120 cm-1 associated with H2 formed and trapped in the bulk.
Current usage metrics show cumulative count of Article Views (full-text article views including HTML views, PDF and ePub downloads, according to the available data) and Abstracts Views on Vision4Press platform.
Data correspond to usage on the plateform after 2015. The current usage metrics is available 48-96 hours after online publication and is updated daily on week days.
Initial download of the metrics may take a while.