Free Access
Fig. 3
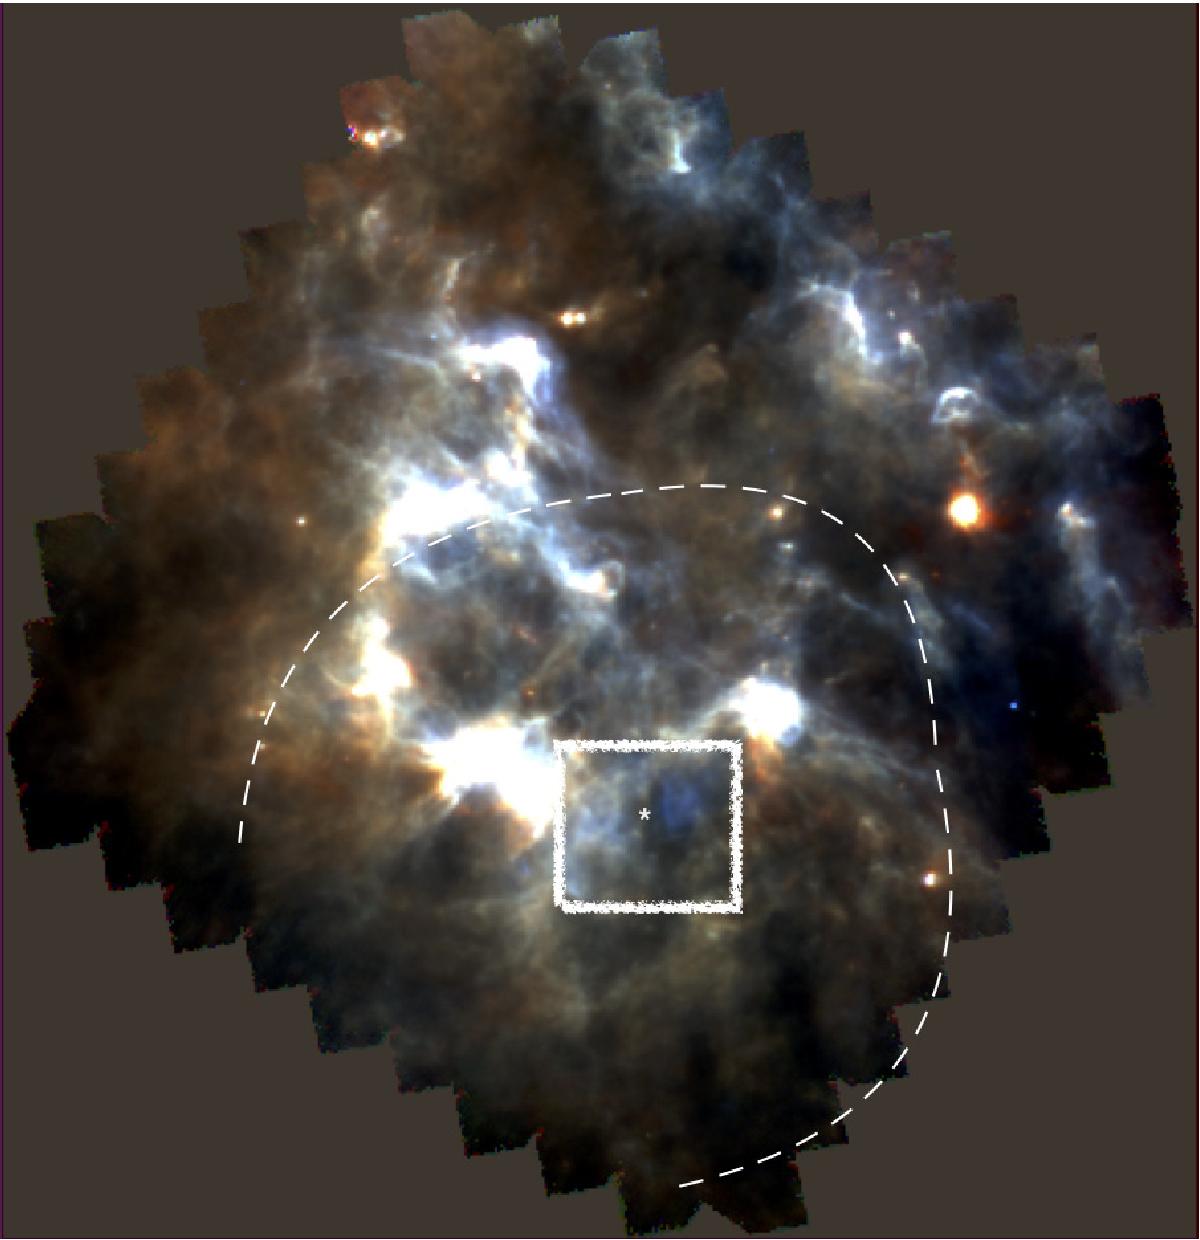
Three-color image of PACS photometer field of view with 70 μm in blue, 100 μm in green and 160 μm in red. North is up and east is left. The box indicates the location of the Hα image (see Fig. 2). The dashed line represents the location of the wind-blown structure at 12′ from HD 148937 (seen on the Hα image).
Current usage metrics show cumulative count of Article Views (full-text article views including HTML views, PDF and ePub downloads, according to the available data) and Abstracts Views on Vision4Press platform.
Data correspond to usage on the plateform after 2015. The current usage metrics is available 48-96 hours after online publication and is updated daily on week days.
Initial download of the metrics may take a while.