Free Access
Fig. 11
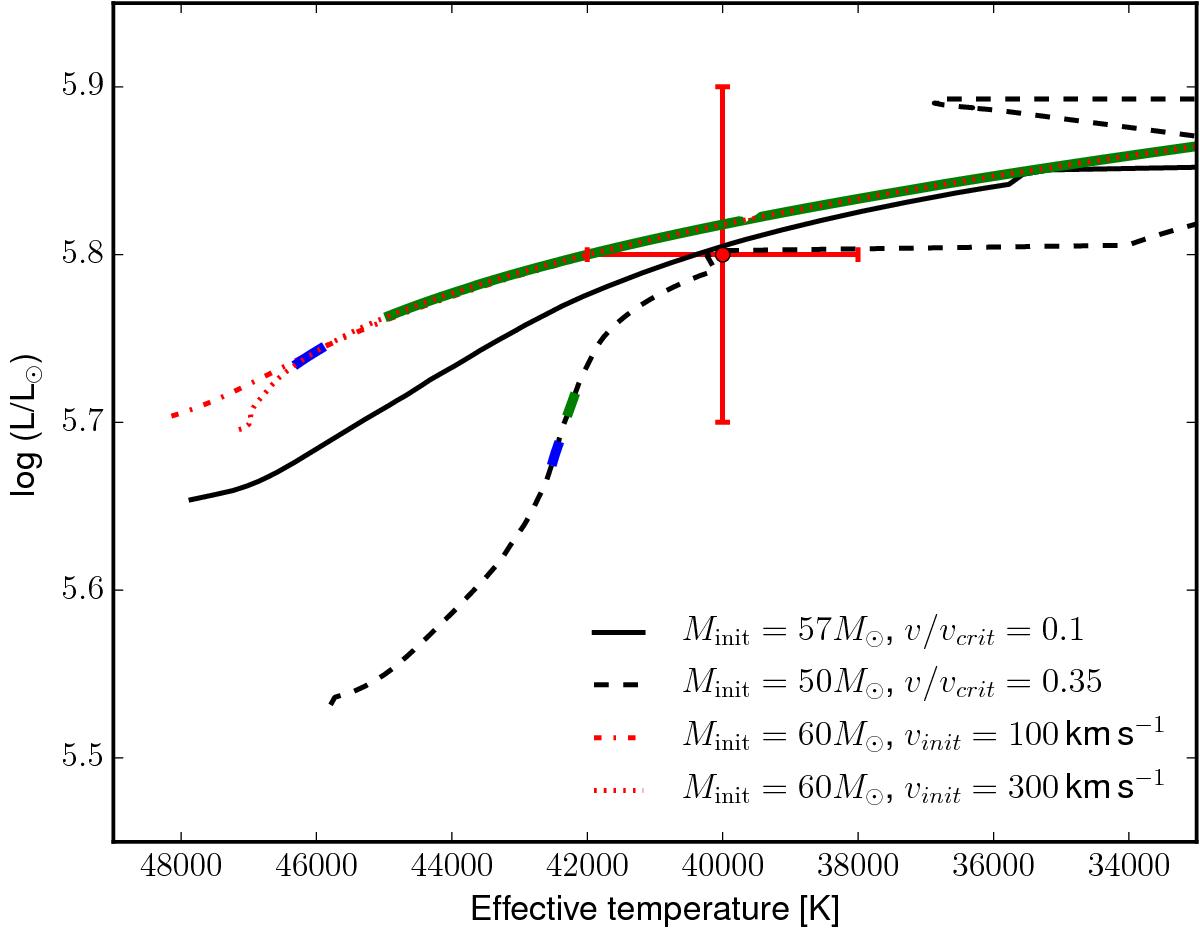
Current location of HD 148937 (red cross) in the HR diagram and locations at the time of nebular ejections, estimated from the N/O ratios of the H1 region in blue and in the H2 region in green. Evolutionary tracks in black are from Ekström et al. (2012) whilst the red ones are from Brott et al. (2011).
Current usage metrics show cumulative count of Article Views (full-text article views including HTML views, PDF and ePub downloads, according to the available data) and Abstracts Views on Vision4Press platform.
Data correspond to usage on the plateform after 2015. The current usage metrics is available 48-96 hours after online publication and is updated daily on week days.
Initial download of the metrics may take a while.