Fig. 6
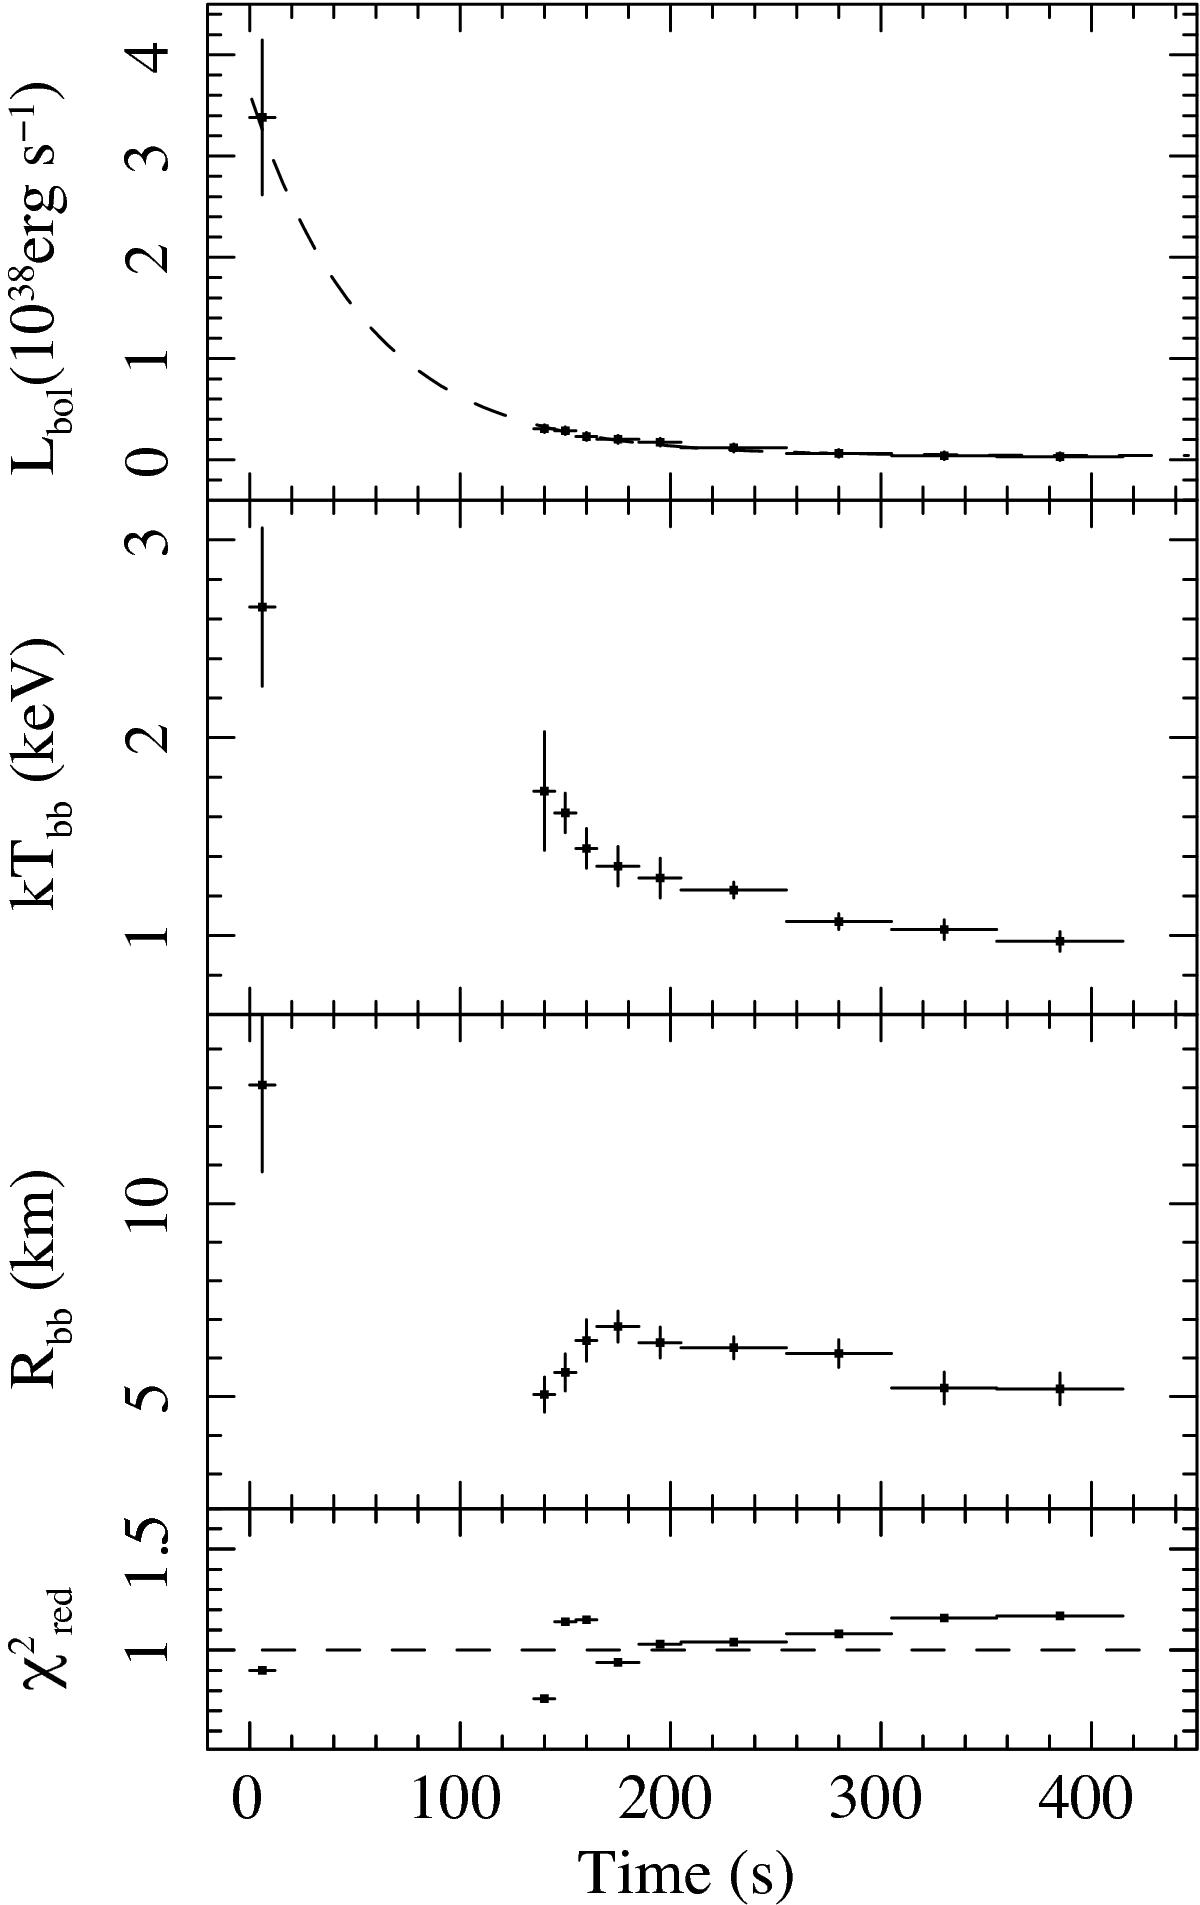
Evolution of the spectral parameters during the type-I burst, as measured from BAT (first point) and XRT. The bolometric luminosity and the bbodyrad radius are computed by using a distance of 4 kpc. The bottom panel shows the ![]() values for all fits. The dashed line in the first upper panel represents the best determined exponential function with which we fit the burst profile. It shows an e-folding time of τfit ≈ 55 s.
values for all fits. The dashed line in the first upper panel represents the best determined exponential function with which we fit the burst profile. It shows an e-folding time of τfit ≈ 55 s.
Current usage metrics show cumulative count of Article Views (full-text article views including HTML views, PDF and ePub downloads, according to the available data) and Abstracts Views on Vision4Press platform.
Data correspond to usage on the plateform after 2015. The current usage metrics is available 48-96 hours after online publication and is updated daily on week days.
Initial download of the metrics may take a while.