Fig. 3
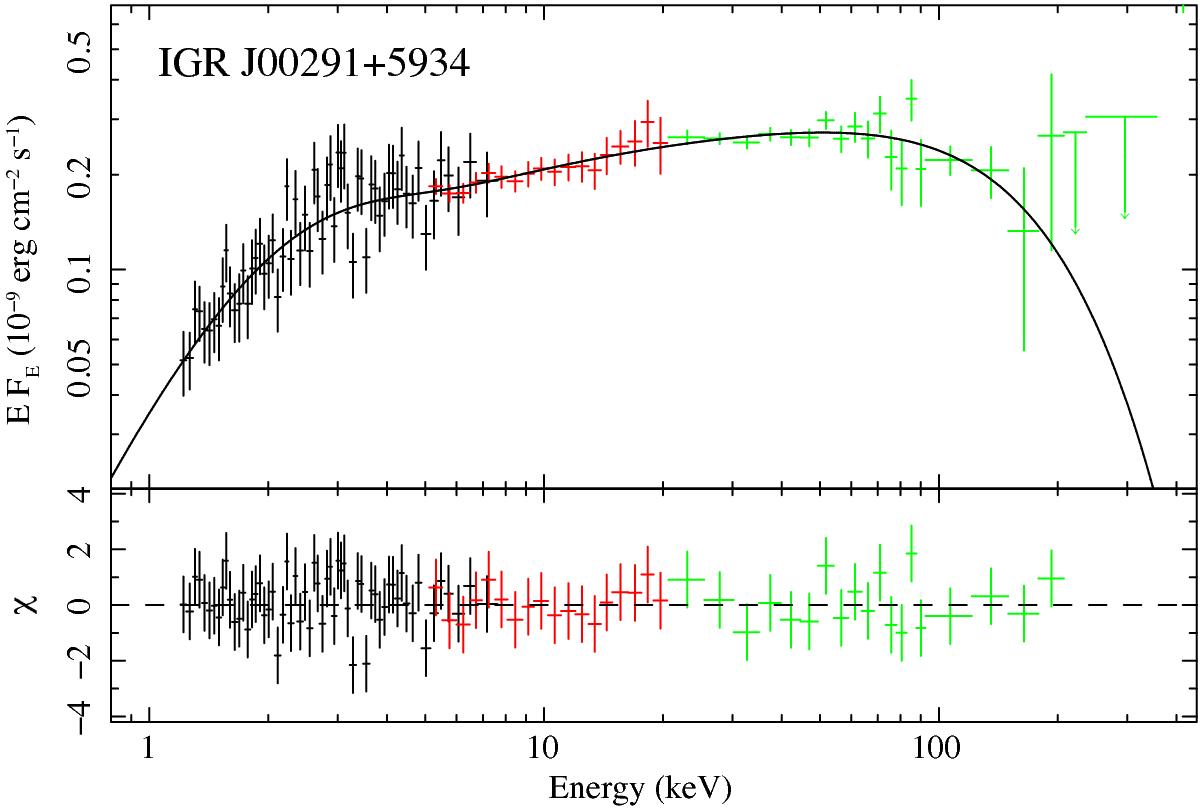
Unfolded measured broad-band spectrum of IGR J00291+5934 as observed by JEM-X (red points), ISGRI (green points) and Swift/XRT (black points). The best fit is obtained with the compps model with a plasma temperature kT ≈ 50 keV, which is represented in the figure with a solid black line. The residuals from the best fit are shown in the bottom panel.
Current usage metrics show cumulative count of Article Views (full-text article views including HTML views, PDF and ePub downloads, according to the available data) and Abstracts Views on Vision4Press platform.
Data correspond to usage on the plateform after 2015. The current usage metrics is available 48-96 hours after online publication and is updated daily on week days.
Initial download of the metrics may take a while.