Fig. 7
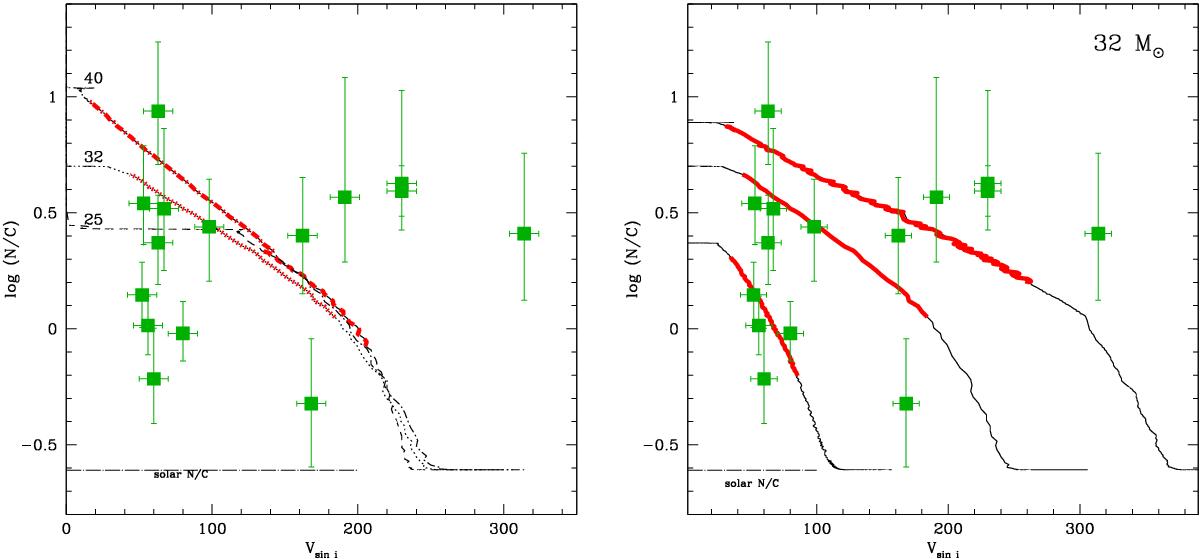
As Fig. 4 with evolutionary models including rotation from Ekström et al. (2012). The red bold part of the tracks corresponds to 3.3 < log g < 3.7, the range covered by the sample stars. Left panel: evolutionary tracks with initial masses 25, 32 and 40 M⊙ and an initial rotational velocity of ~300 km s-1. Right panel: evolutionary tracks with an initial mass of 32 M⊙ and various initial rotational velocities.
Current usage metrics show cumulative count of Article Views (full-text article views including HTML views, PDF and ePub downloads, according to the available data) and Abstracts Views on Vision4Press platform.
Data correspond to usage on the plateform after 2015. The current usage metrics is available 48-96 hours after online publication and is updated daily on week days.
Initial download of the metrics may take a while.