Fig. 3
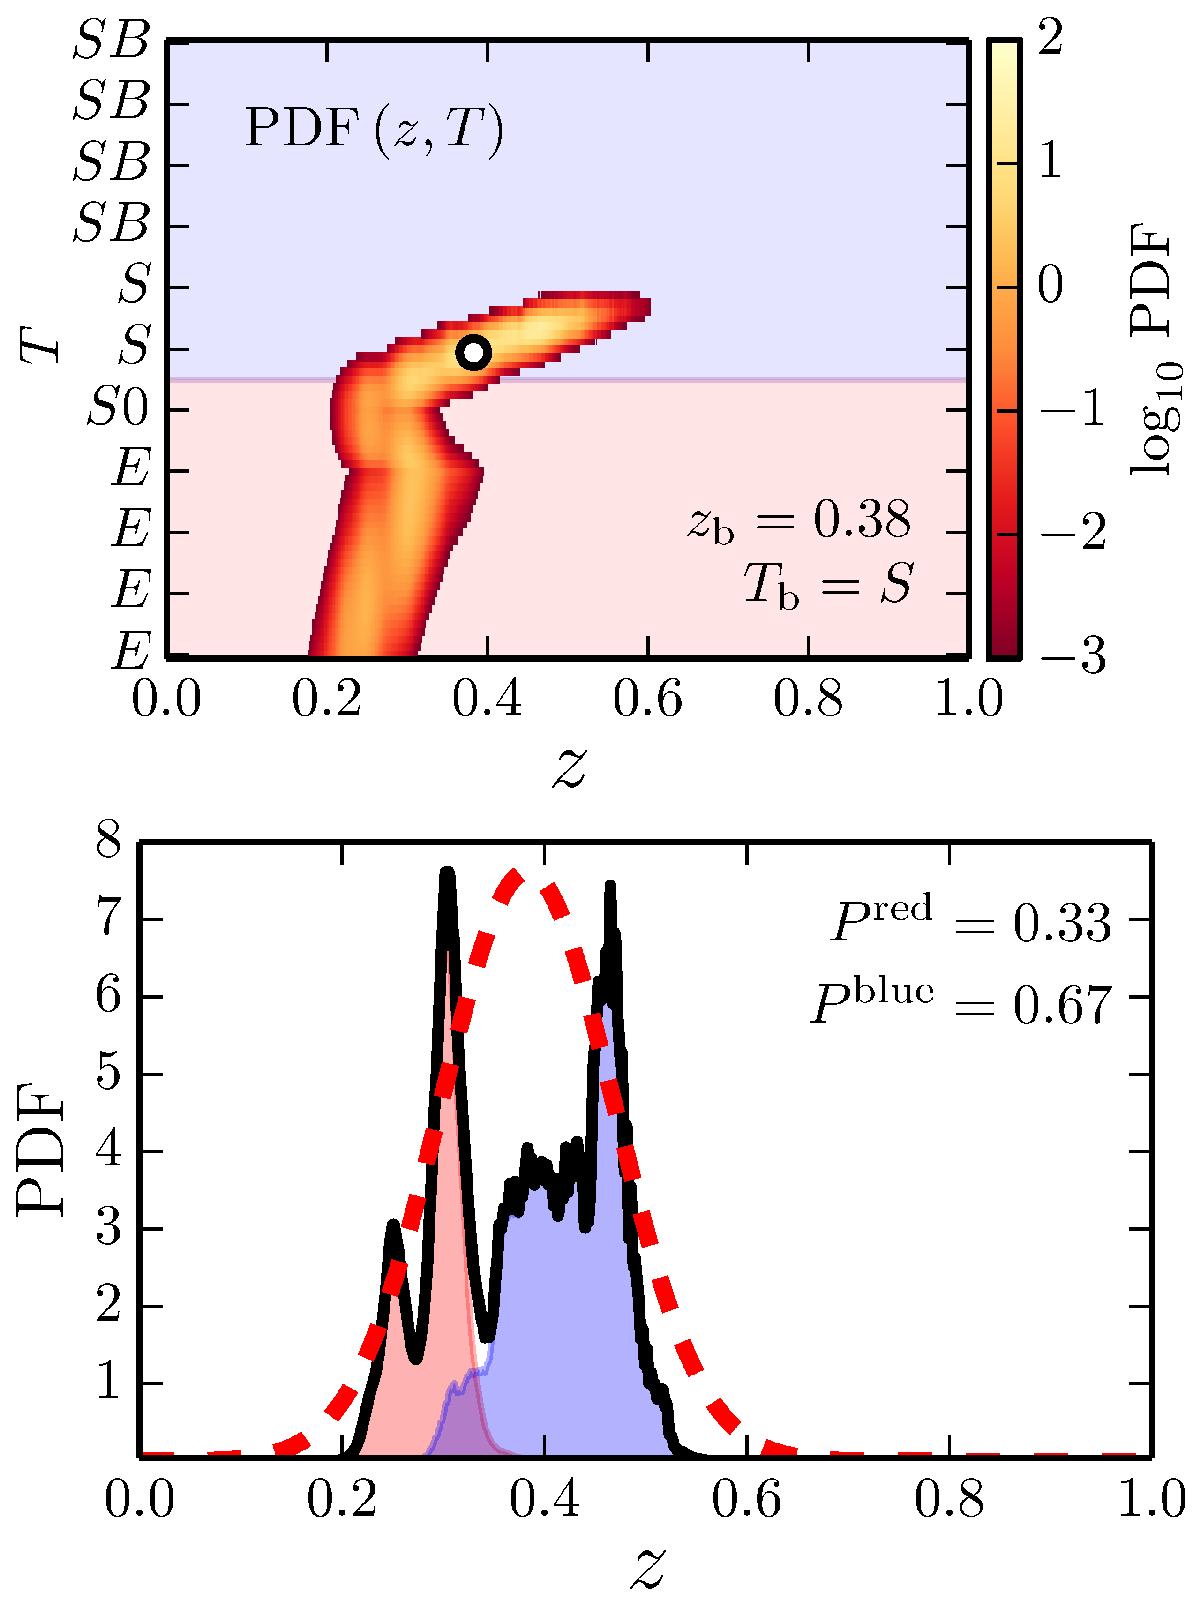
Top panel: probability distribution function in the redshift – spectral template (z−T) space of an ALHAMBRA galaxy with observed magnitude I = 22.17 ± 0.06. The white dot marks the best Bayesian redshift and template, labelled in the panel. The red area marks red spectral templates (E/S0), and the blue area the blue spectral templates (S/SB). Bottom panel: projection of the top PDF (z,T) in redshift space. The black solid line marks the total PDF (z), while the red and blue areas mark the contribution of early and late templates, respectively. This galaxy counts 0.33 as red and 0.67 as blue in our statistical analysis. The red dashed line illustrates the poor Gaussian approximation to this PDF.
Current usage metrics show cumulative count of Article Views (full-text article views including HTML views, PDF and ePub downloads, according to the available data) and Abstracts Views on Vision4Press platform.
Data correspond to usage on the plateform after 2015. The current usage metrics is available 48-96 hours after online publication and is updated daily on week days.
Initial download of the metrics may take a while.