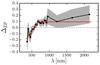
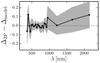
Fig. A.2
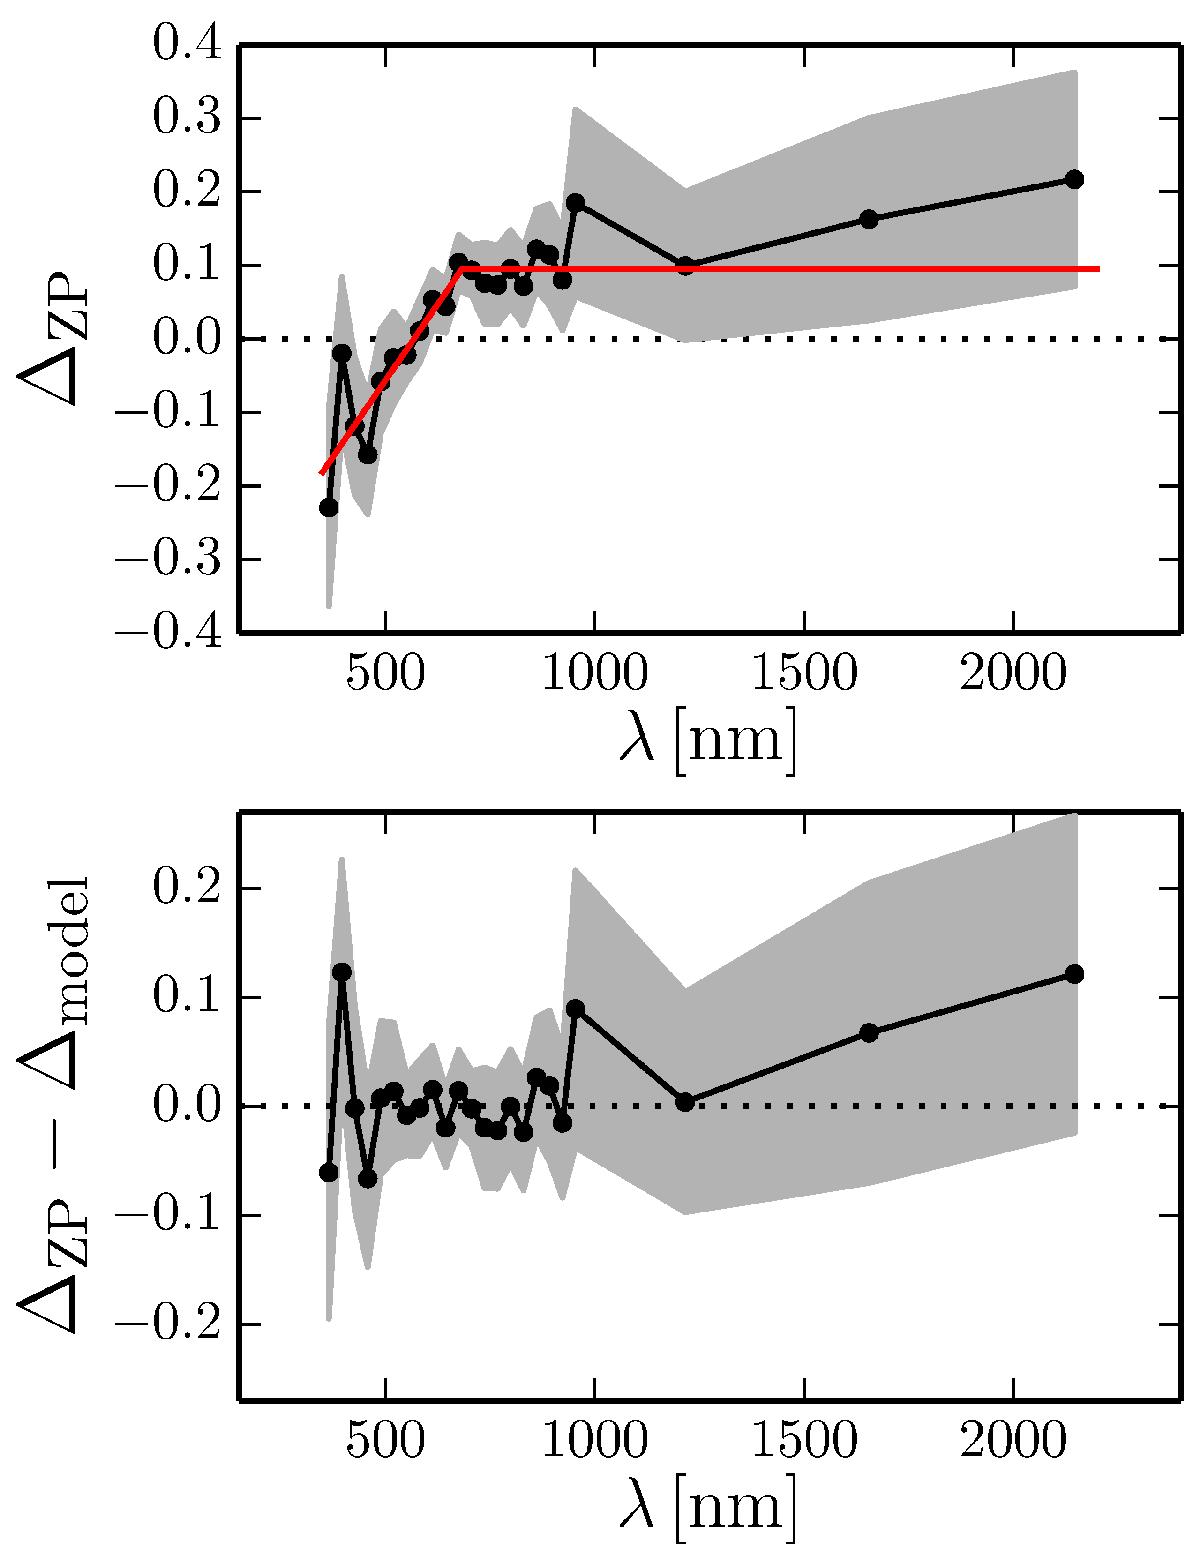
Top panel: median zero point correction ΔZP applied by BPZ2 to the original ALHAMBRA photometry (black points). The observed structure is modelled with a linear function and a constant value (red solid line). Bottom panel: residual zero point correction after removing the model from the median correction. The grey area in both panels shows the field-to-field dispersion of the correction.
Current usage metrics show cumulative count of Article Views (full-text article views including HTML views, PDF and ePub downloads, according to the available data) and Abstracts Views on Vision4Press platform.
Data correspond to usage on the plateform after 2015. The current usage metrics is available 48-96 hours after online publication and is updated daily on week days.
Initial download of the metrics may take a while.