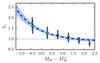
Fig. 14
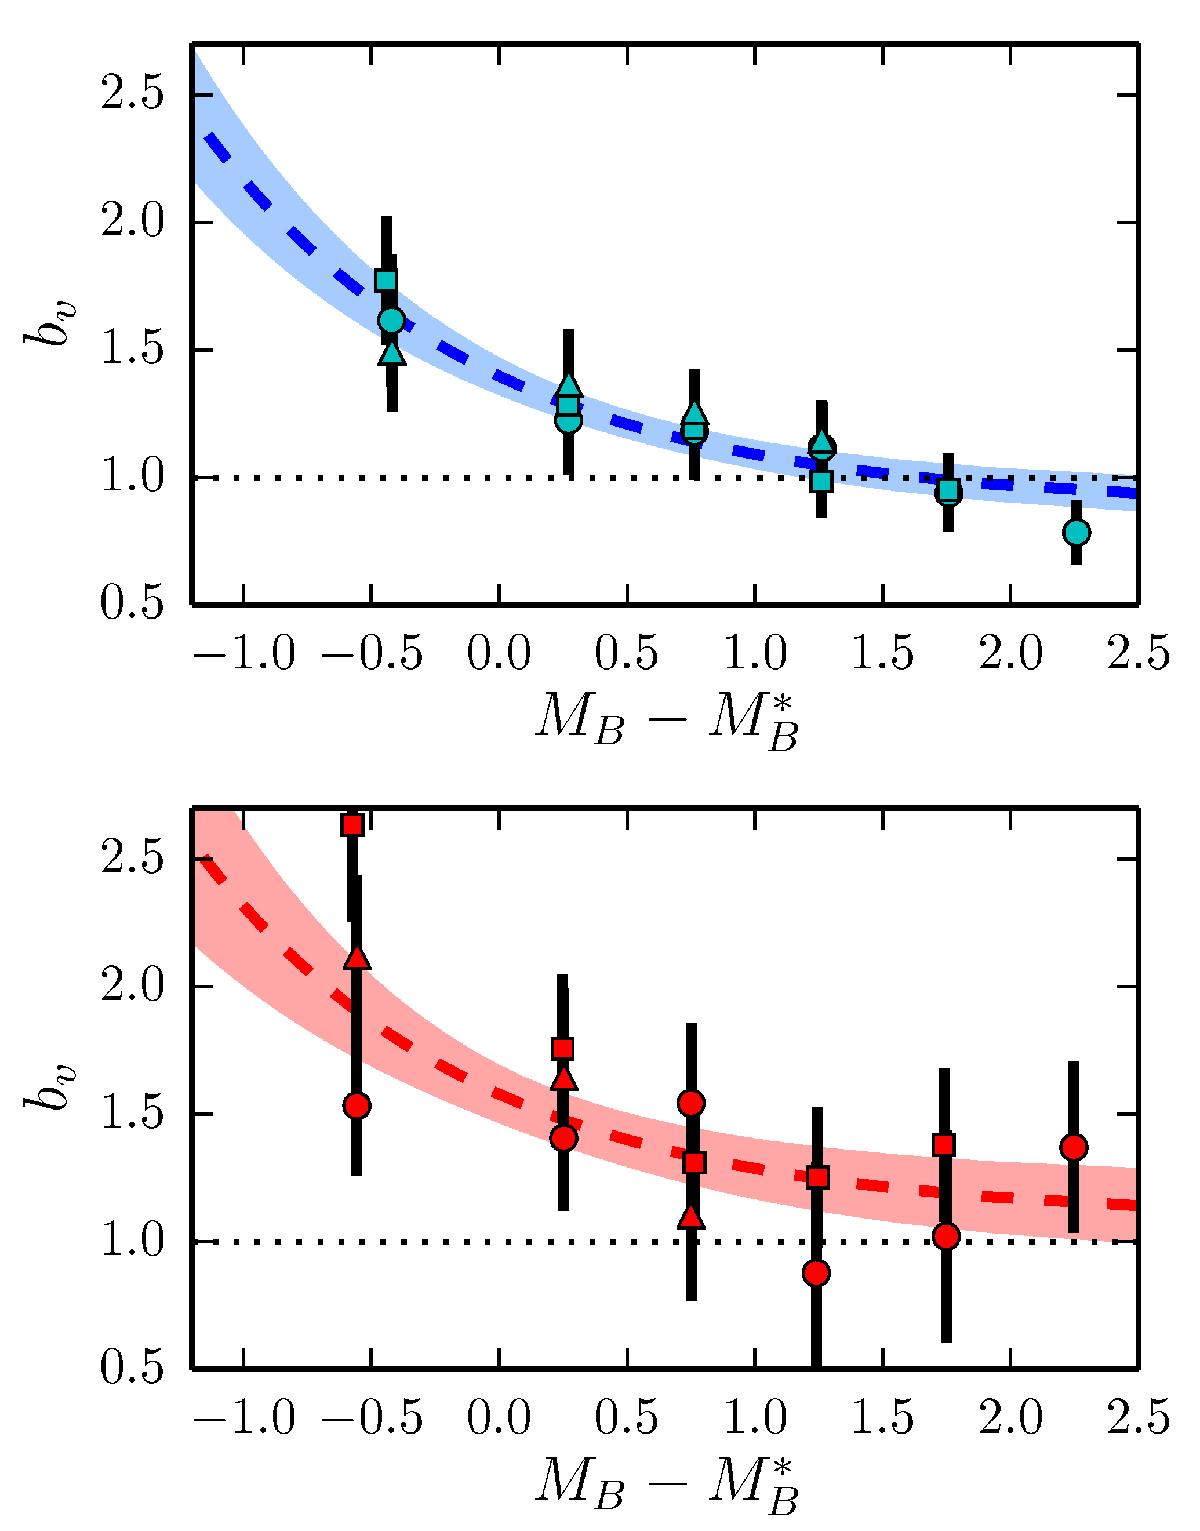
Bias function of star-forming (top) and quiescent (bottom) galaxies as a function of ![]() for three different redshift bins, 0.2 ≤ z < 0.65 (dots), 0.65 ≤ z < 0.85 (squares), and 0.85 ≤ z < 1 (triangles). The dashed lines show the median model to the ALHAMBRA data, with the coloured areas enclosing 68% of the solutions. The dotted lines mark a galaxy bias bv = 1.
for three different redshift bins, 0.2 ≤ z < 0.65 (dots), 0.65 ≤ z < 0.85 (squares), and 0.85 ≤ z < 1 (triangles). The dashed lines show the median model to the ALHAMBRA data, with the coloured areas enclosing 68% of the solutions. The dotted lines mark a galaxy bias bv = 1.
Current usage metrics show cumulative count of Article Views (full-text article views including HTML views, PDF and ePub downloads, according to the available data) and Abstracts Views on Vision4Press platform.
Data correspond to usage on the plateform after 2015. The current usage metrics is available 48-96 hours after online publication and is updated daily on week days.
Initial download of the metrics may take a while.