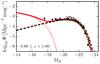
Fig. 12
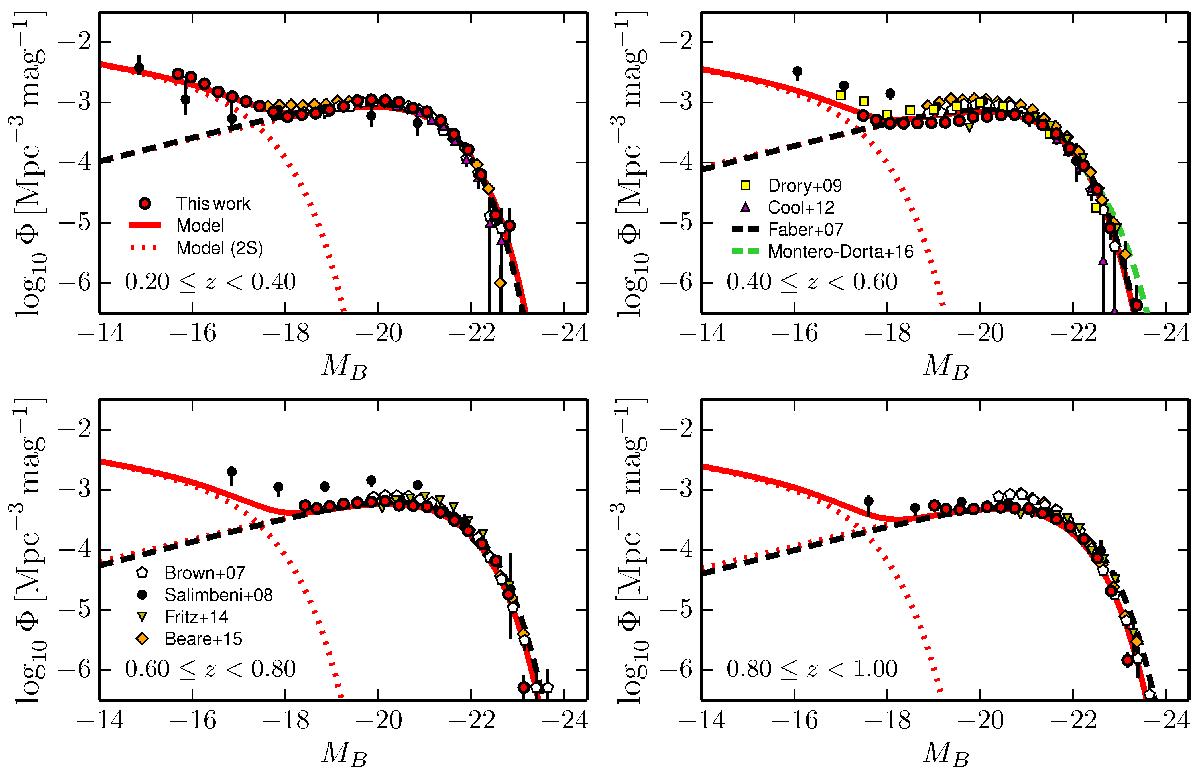
ALHAMBRA luminosity function of quiescent galaxies in four redshift bins (labelled in the panels). The red dots are the observed luminosity functions and the red solid line the median model. The dotted red lines show the bright and faint component of the median model. The dashed black lines are the best fitting from Faber et al. (2007), including DEEP2, COMBO-17, 2dFGS (Madgwick et al. 2002), and SDSS (Bell et al. 2003). The dashed green line is from Montero-Dorta et al. (2016) in BOSS at z = 0.55. The white pentagons are from Brown et al. (2007) in the NDWFS, the black dots from Salimbeni et al. (2008) in GOODS-MUSIC, the purple triangles from Cool et al. (2012) in AGES, the yellow squares from Drory et al. (2009) in the COSMOS field, the inverted green triangles from Fritz et al. (2014) in VIPERS, and the orange diamonds from Beare et al. (2015) in Böotes.
Current usage metrics show cumulative count of Article Views (full-text article views including HTML views, PDF and ePub downloads, according to the available data) and Abstracts Views on Vision4Press platform.
Data correspond to usage on the plateform after 2015. The current usage metrics is available 48-96 hours after online publication and is updated daily on week days.
Initial download of the metrics may take a while.