Fig. 10
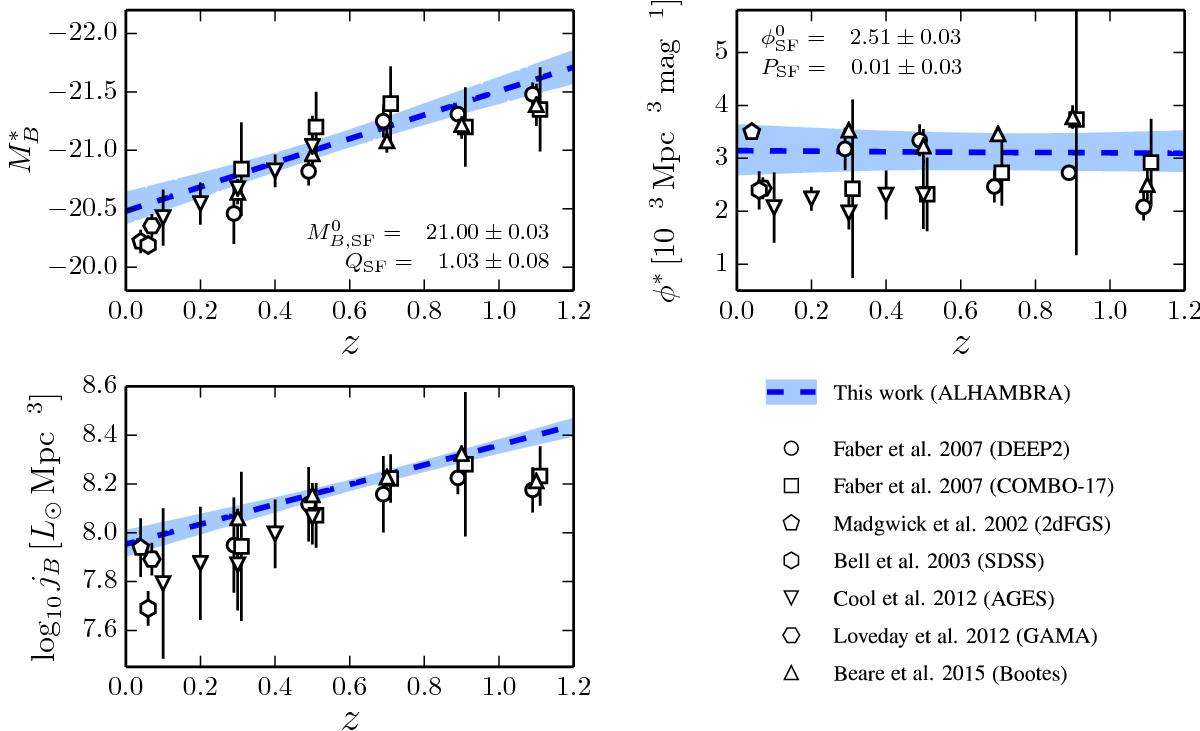
Redshift evolution for star-forming galaxies of ![]() (top left panel), φ∗ ∝ 10PSFz (top right panel), and the B-band luminosity density jB (bottom left panel). In all panels the blue dashed line show the median model from ALHAMBRA data, with the coloured areas enclosing 95% of the solutions. The median of the parameters with their associated 68% (1σ) probability intervals are labelled in the panels. The other symbols, labelled in the bottom right panel, are from the literature. Their error bars mark 2σ confidence intervals.
(top left panel), φ∗ ∝ 10PSFz (top right panel), and the B-band luminosity density jB (bottom left panel). In all panels the blue dashed line show the median model from ALHAMBRA data, with the coloured areas enclosing 95% of the solutions. The median of the parameters with their associated 68% (1σ) probability intervals are labelled in the panels. The other symbols, labelled in the bottom right panel, are from the literature. Their error bars mark 2σ confidence intervals.
Current usage metrics show cumulative count of Article Views (full-text article views including HTML views, PDF and ePub downloads, according to the available data) and Abstracts Views on Vision4Press platform.
Data correspond to usage on the plateform after 2015. The current usage metrics is available 48-96 hours after online publication and is updated daily on week days.
Initial download of the metrics may take a while.