Fig. 2
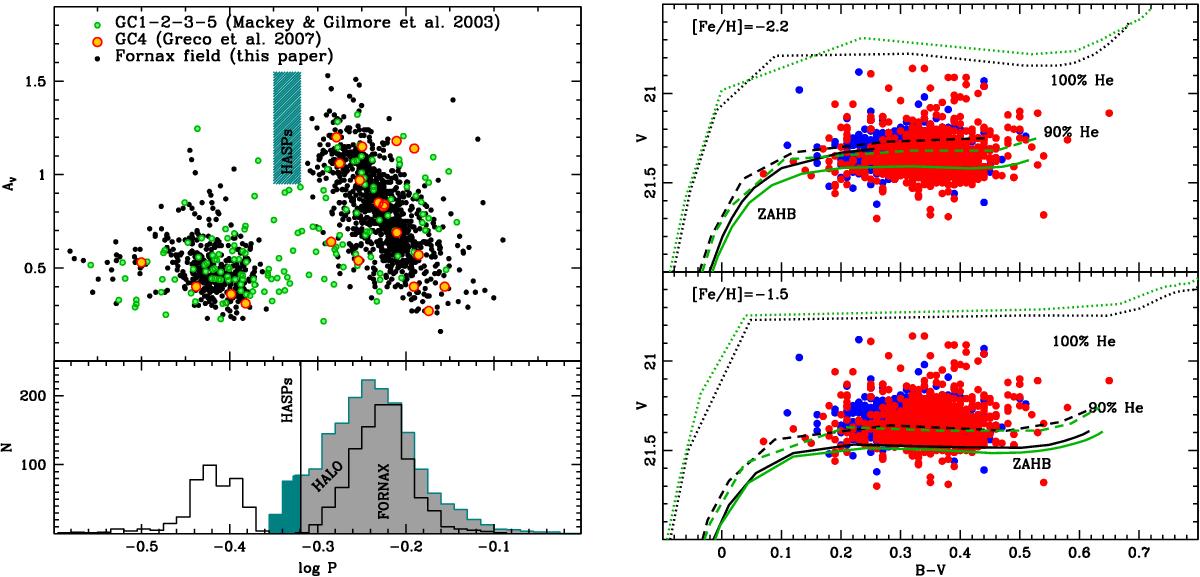
Left panels: period-V band amplitude (Bailey) diagram (top) and the period distribution (bottom) of the 1426 Fornax RRLs (black dots). RRLs in the Fornax globular clusters are also shown. The teal coloured region indicates the HASPs’ location. The grey/teal histogram is the period distribution of ~15 000 Halo RRLs. Right panels: zoom on the horizontal branch of the Fornax dSph is shown compared with theoretical predictions for scaled-solar (black lines) and alpha-enhanced (dark green lines) chemical compositions. The loci of the zero age horizontal branch (solid lines) of the stars that have burned 90% (dashed) and 100% (dotted) of their central helium are shown for two selected metal abundances.
Current usage metrics show cumulative count of Article Views (full-text article views including HTML views, PDF and ePub downloads, according to the available data) and Abstracts Views on Vision4Press platform.
Data correspond to usage on the plateform after 2015. The current usage metrics is available 48-96 hours after online publication and is updated daily on week days.
Initial download of the metrics may take a while.