Free Access
Fig. 4
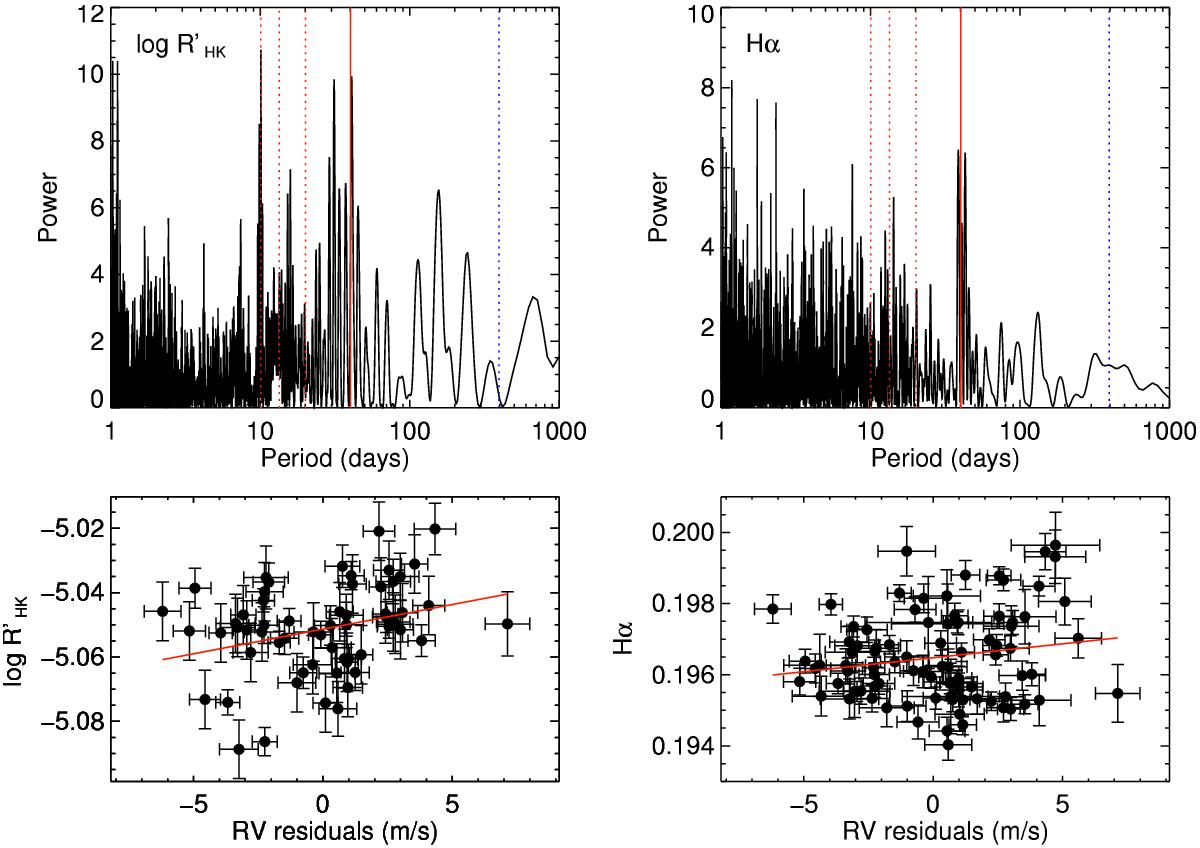
Upper panels: periodograms of the ![]() (with S/N> 20) and of the Hα indices for HARPS-N data. The red solid line indicates the 40.2 d period, the red dotted lines represent its 1st, 2nd and the 3rd harmonics; the blue dotted line indicates the period of planet b. Lower panels: correlation with the RV residuals.
(with S/N> 20) and of the Hα indices for HARPS-N data. The red solid line indicates the 40.2 d period, the red dotted lines represent its 1st, 2nd and the 3rd harmonics; the blue dotted line indicates the period of planet b. Lower panels: correlation with the RV residuals.
Current usage metrics show cumulative count of Article Views (full-text article views including HTML views, PDF and ePub downloads, according to the available data) and Abstracts Views on Vision4Press platform.
Data correspond to usage on the plateform after 2015. The current usage metrics is available 48-96 hours after online publication and is updated daily on week days.
Initial download of the metrics may take a while.