Fig. 5
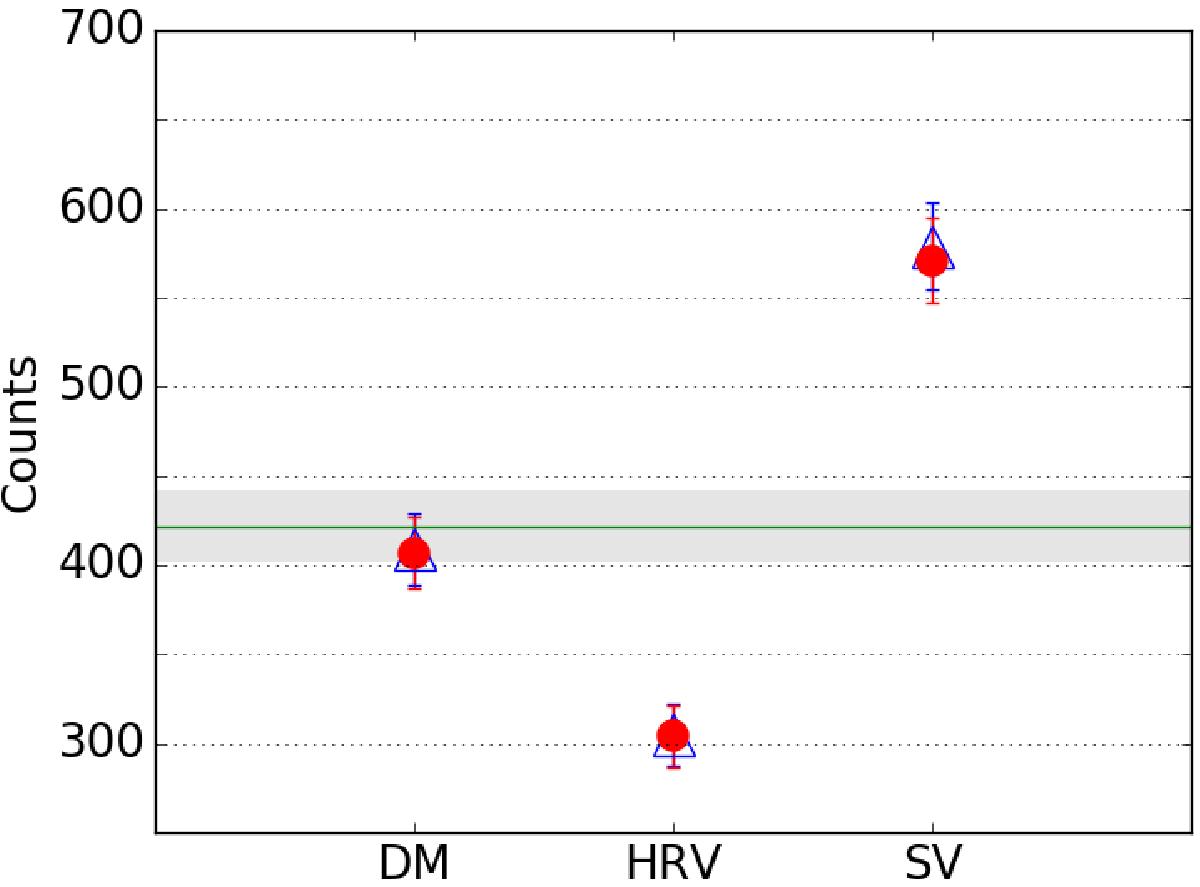
Testing the IMF. Cepheid counts for the complete region up to V = 12. Up to V = 9 the observational Cepheid catalogues are considered as being complete for the whole sky while for the interval 9 < V ≤ 12 they are supposed to be complete for δ ≤ 29. In the interval 9 < V ≤ 12, an additional cut (|b| ≤ 10) is applied to avoid contamination of the observational sample. The green line indicates the observational counts, the grey region is the region within 1σ. Filled red dots are for the simulations with the Marshall et al. (2006) extinction model, while blue triangles are simulations with the Drimmel & Spergel (2001) extinction model. Error bars are due to Poisson noise. We note how the DM, that is Kroupa-Haywood IMF, is the variant that better fits the observational data, while HRV, that is Haywood-Robin IMF and SV (Salpeter IMF), are more than 5σ away from the observational data.
Current usage metrics show cumulative count of Article Views (full-text article views including HTML views, PDF and ePub downloads, according to the available data) and Abstracts Views on Vision4Press platform.
Data correspond to usage on the plateform after 2015. The current usage metrics is available 48-96 hours after online publication and is updated daily on week days.
Initial download of the metrics may take a while.