Fig. 10
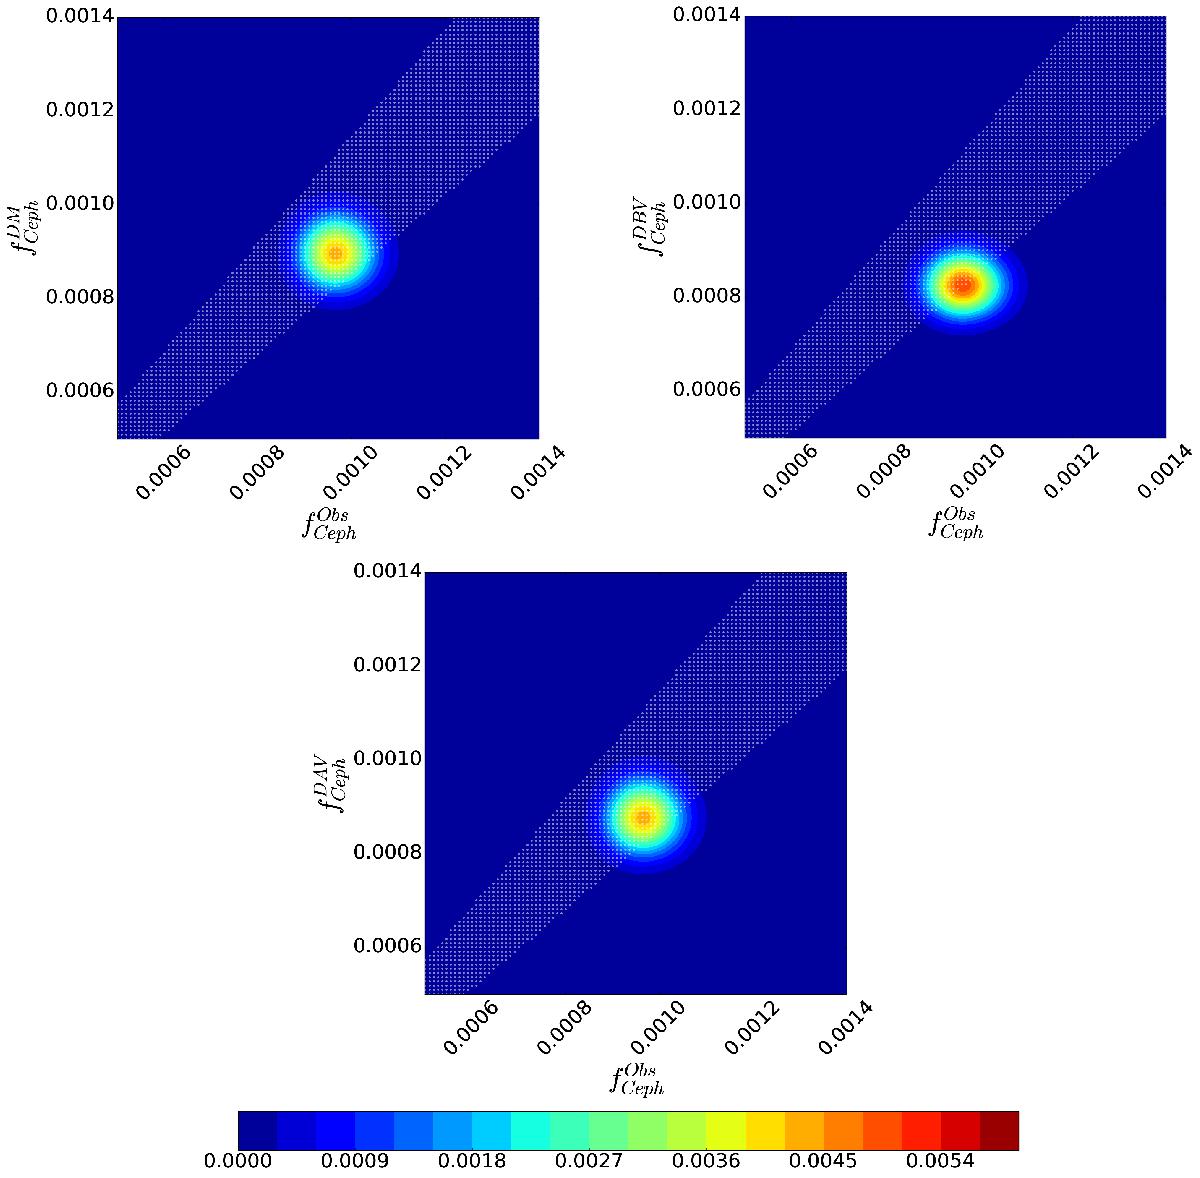
Full 2D posterior probability distribution function. The white stripe shows the tolerance interval region. The plot is for the three cases in Fig. 6 that needs a disambiguation: top left panel: DM; top right panel: DBV (different local density); bottom panel: DAV (best fit model with new scale length). Note here how DM and DAV are almost completely inside the tolerance region, while DBV is half out. DM has an ≈85% of probability to have the same observed Cepheid fraction as the Milky Way up to magnitude V = 11, while DBV is just in the ≈50%.
Current usage metrics show cumulative count of Article Views (full-text article views including HTML views, PDF and ePub downloads, according to the available data) and Abstracts Views on Vision4Press platform.
Data correspond to usage on the plateform after 2015. The current usage metrics is available 48-96 hours after online publication and is updated daily on week days.
Initial download of the metrics may take a while.