Free Access
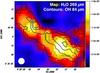
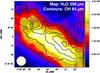
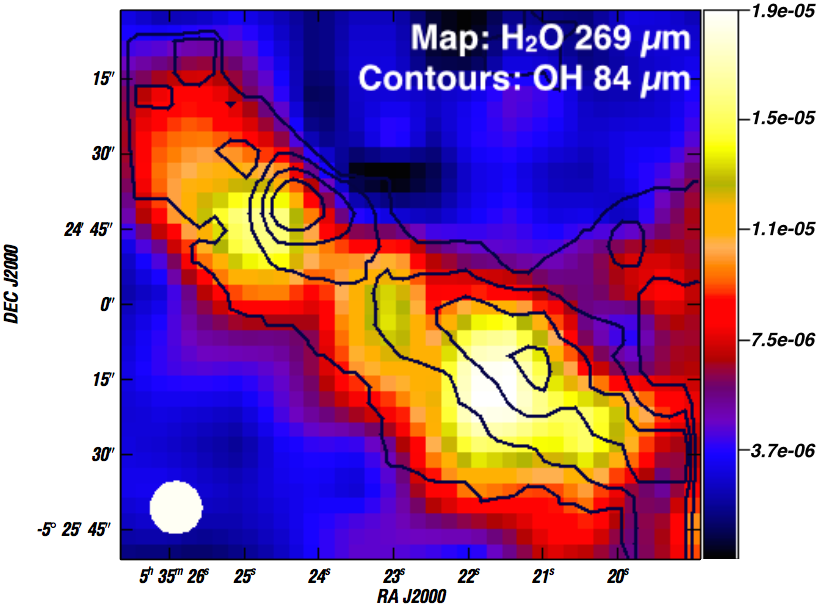
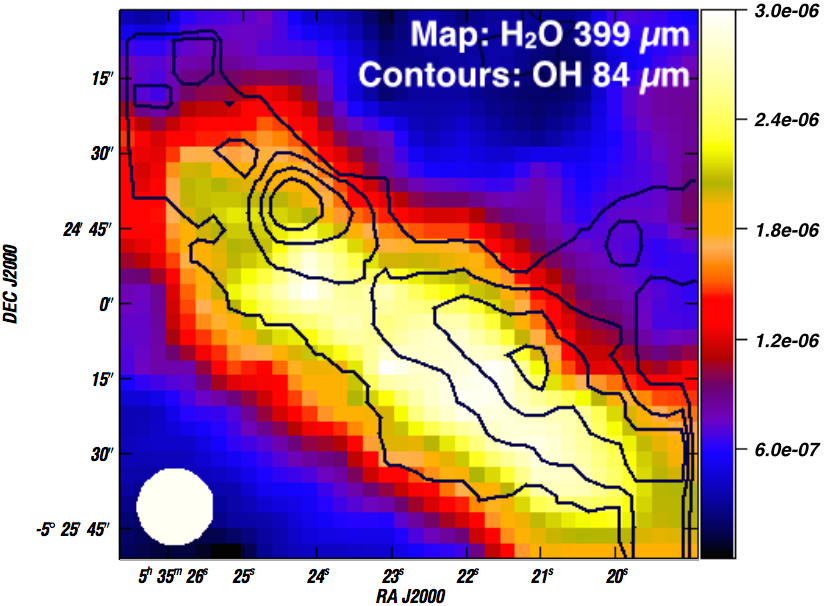
Fig. 8

Maps of H2O 111–000 at 269 μm (left) and H2O 211–202 399 μm (right) with contours of OH 84.6 μm with contour steps of 20% of the peak emission. The maps are in units of erg s-1 cm-2 sr-1.
This figure is made of several images, please see below:
Current usage metrics show cumulative count of Article Views (full-text article views including HTML views, PDF and ePub downloads, according to the available data) and Abstracts Views on Vision4Press platform.
Data correspond to usage on the plateform after 2015. The current usage metrics is available 48-96 hours after online publication and is updated daily on week days.
Initial download of the metrics may take a while.