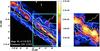
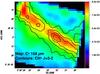
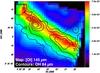
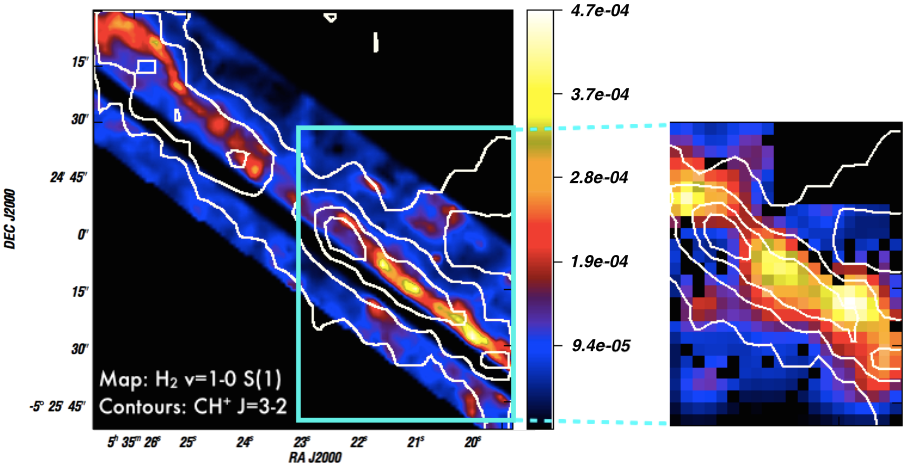
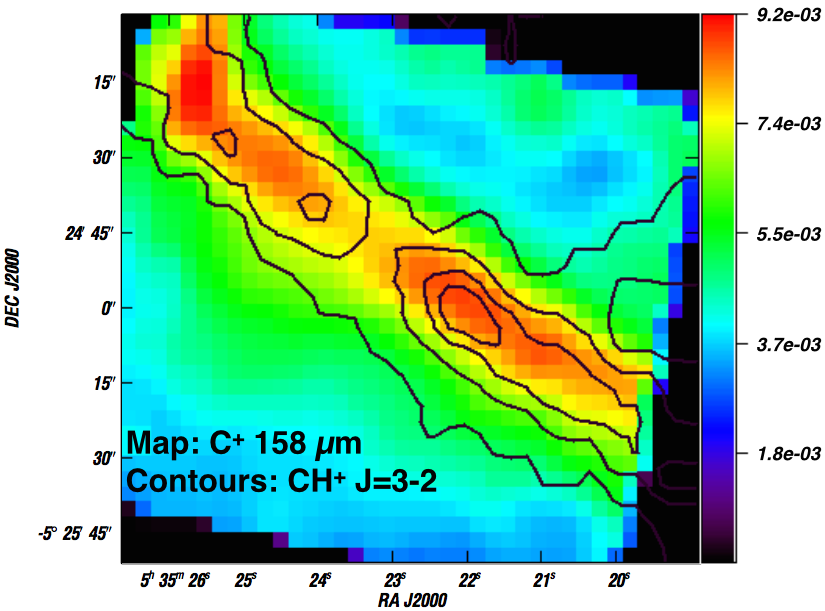
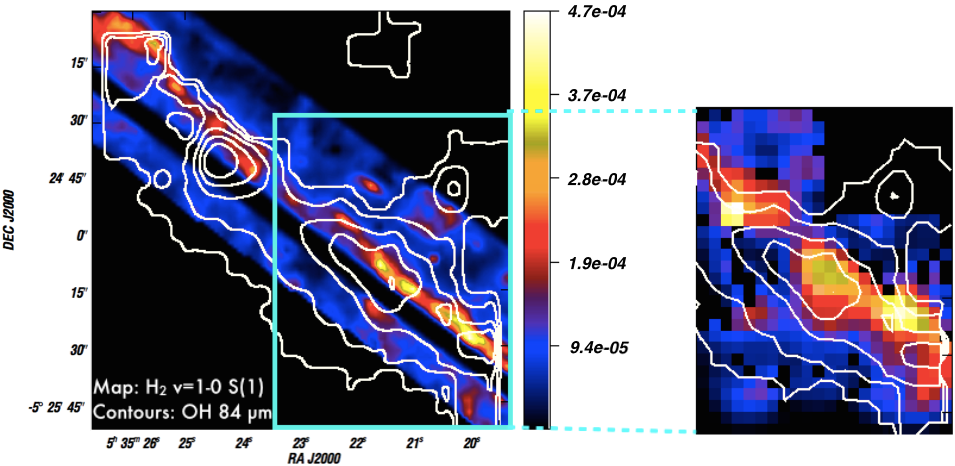
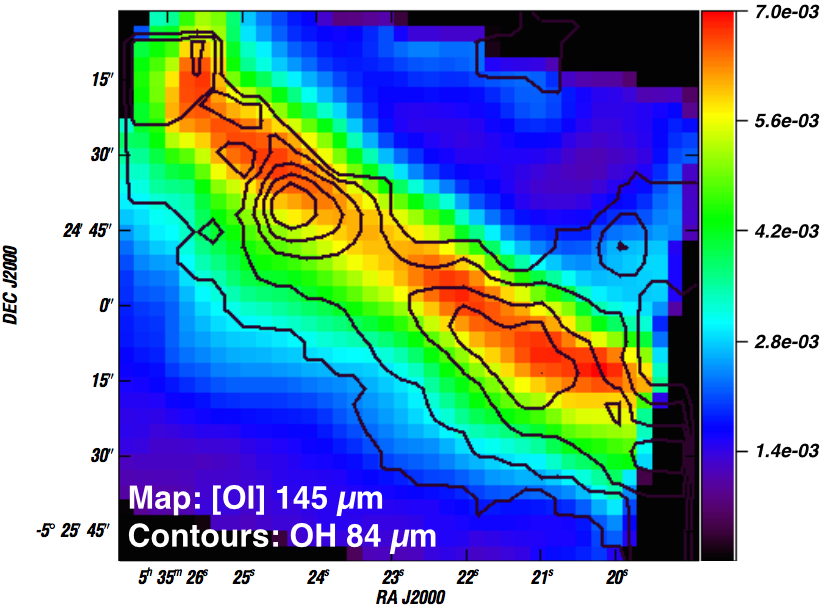
Fig. 7

Top row: CH+ 120 μm compared with H2v = 1–0 S(1) and [CII] 158 μm. CH+ 120 μm contours overlaid on the H2 map (left) and [CII] map (right). Zoom: map of vibrationally excited H2 convolved to the spatial resolution of CH+J = 3–2 map including contours of CH+J = 3–2. Bottom row: OH 84 μm compared with H2v = 1–0 S(1) and [OI] 145 μm. OH 84 μm contours overlaid on the H2 map (left) and [OI] map (right). All contours are with contour steps of 20% of the peak emission, except for the zoomed picture where the contours are with contour steps of 10%. The maps are in units of erg s-1 cm-2 sr-1. The H2v = 1–0 S(1) data taken from Walmsley et al. (2000, big map) and van der Werf et al. (1996, zoomed map). The [CII] 158 μm and [OI] 145 μm data were taken from Bernard-Salas et al. (2012).
Current usage metrics show cumulative count of Article Views (full-text article views including HTML views, PDF and ePub downloads, according to the available data) and Abstracts Views on Vision4Press platform.
Data correspond to usage on the plateform after 2015. The current usage metrics is available 48-96 hours after online publication and is updated daily on week days.
Initial download of the metrics may take a while.