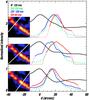
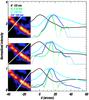
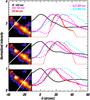
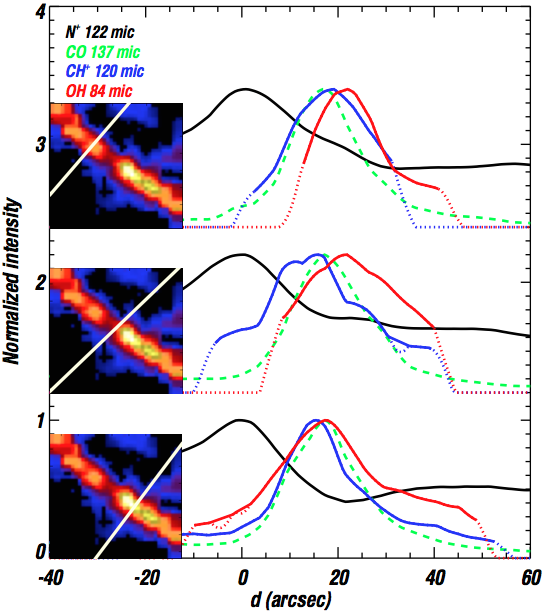
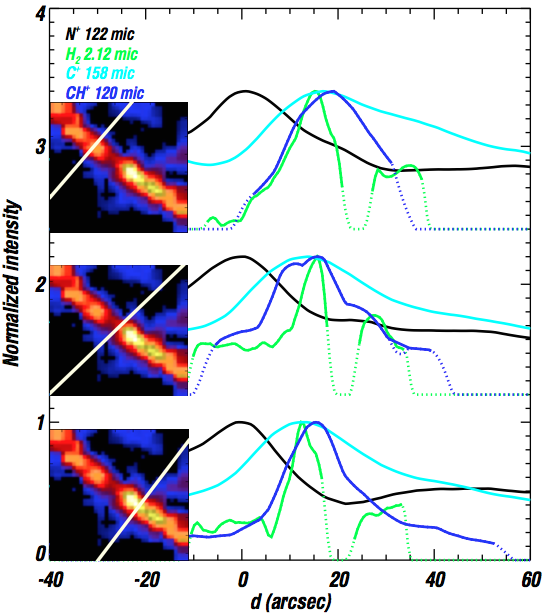
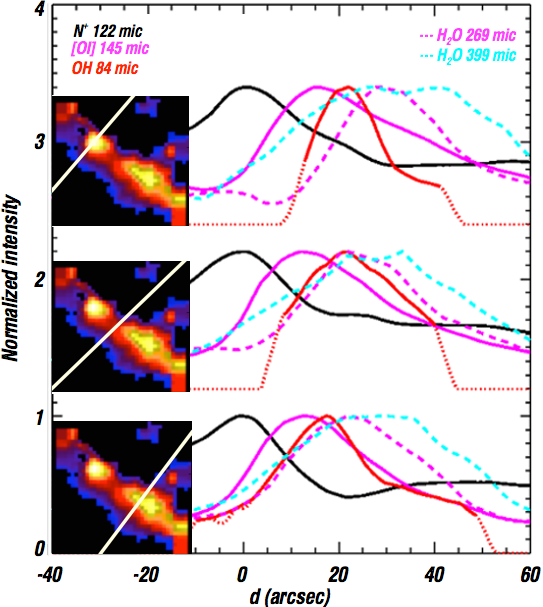
Fig. 6

Profile cuts across the Bar at positions indicated in the small CH+J = 3–2 and OH 84 μm maps. The intensity of the lines have been normalized to the maximum emission in the Bar and the lines are not convolved to the same beam, so that the structures seen in the unconvolved maps are not lost. The distance is from the ionization front indicated by the peak of [NII] emission. The dashed part of the H2 profile in the cuts indicates the slit seen in the map (see Fig. 7) and the positions of the cuts are indicated in the small maps next to each cut.
Current usage metrics show cumulative count of Article Views (full-text article views including HTML views, PDF and ePub downloads, according to the available data) and Abstracts Views on Vision4Press platform.
Data correspond to usage on the plateform after 2015. The current usage metrics is available 48-96 hours after online publication and is updated daily on week days.
Initial download of the metrics may take a while.