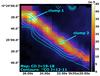
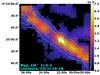
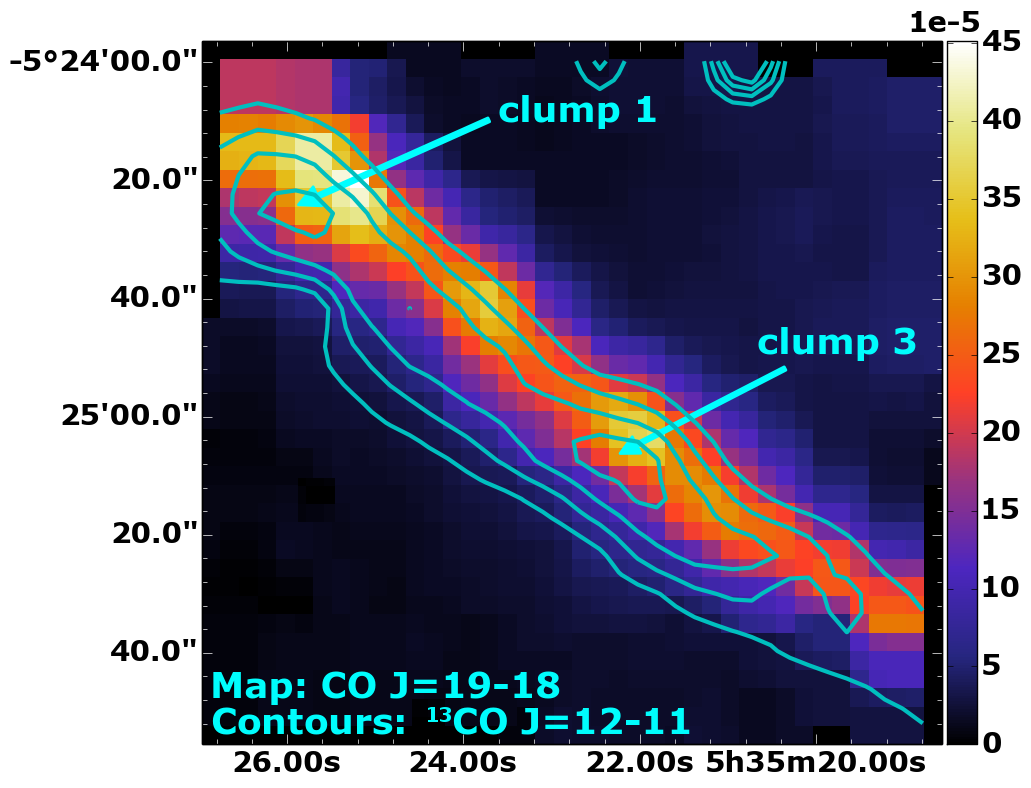
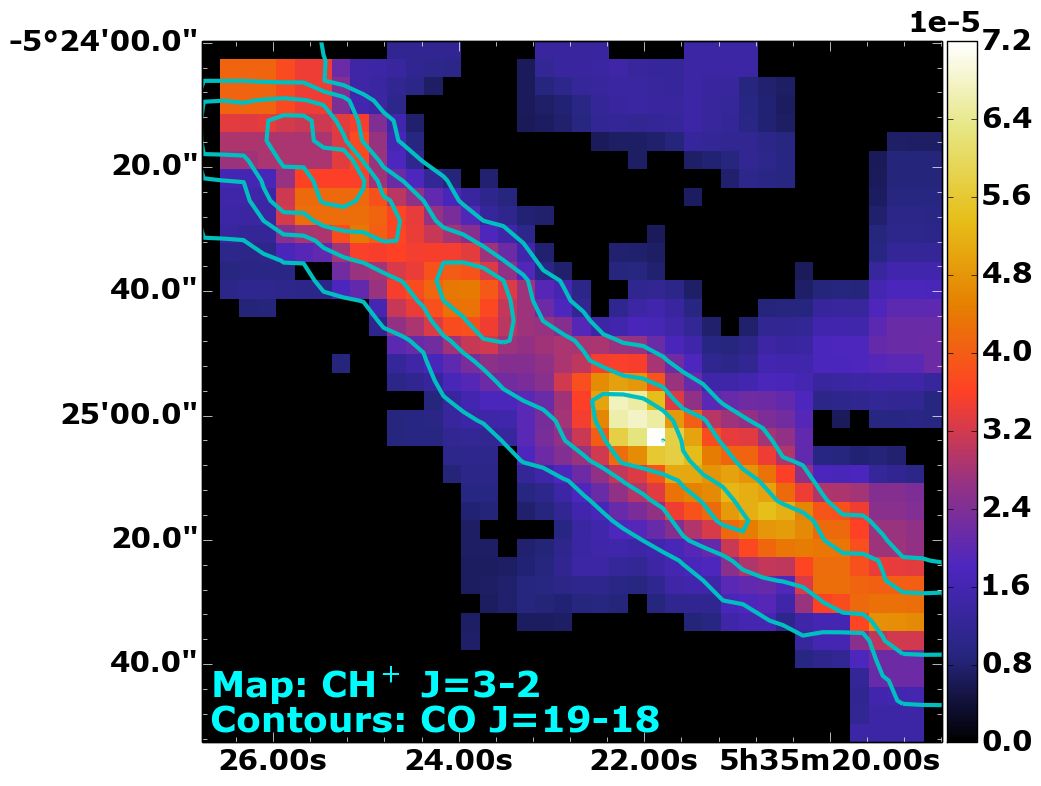
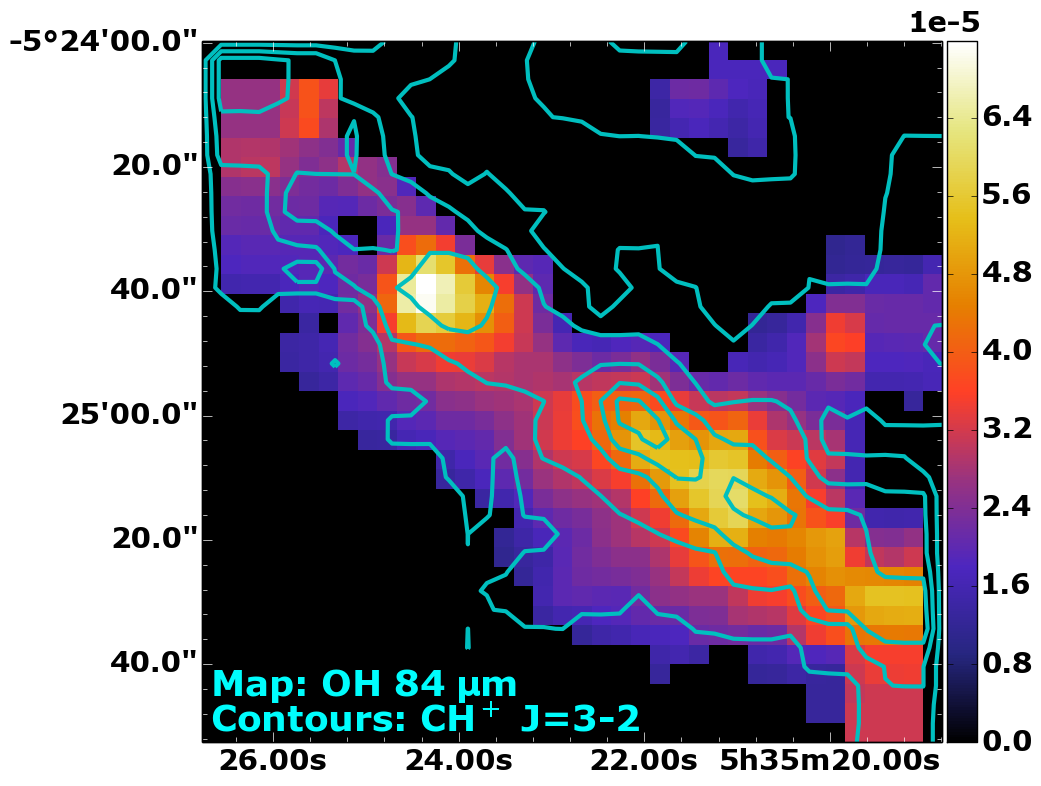
Fig. 5
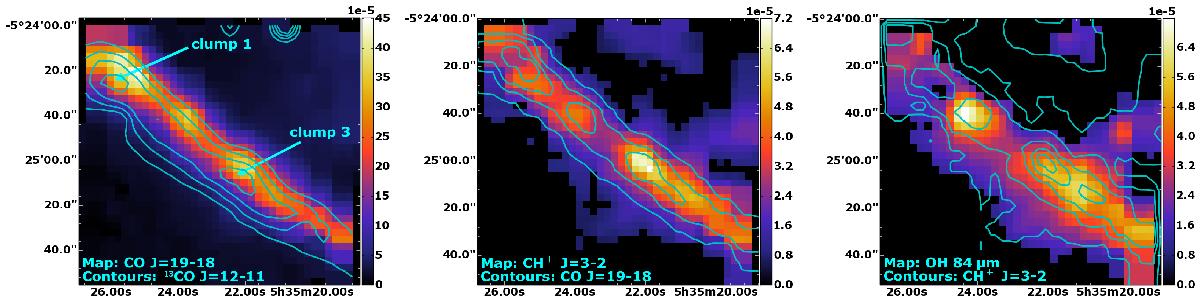
Map of CO J = 19−18 (137 μm) integrated intensity with 13CO J = 12–11 contours (left). Map of CH+J = 3–2 integrated intensity with CO J = 19–18 contours (middle) and OH 84.6 μm with CH+J = 3–2 contours (right). All contours are with contour steps of 20% of the peak emission in the Bar starting from 10%, except 13CO starting from 30%. The intensities are in units of erg s-1 cm-2 sr-1. The maps are not convolved as the resolutions are similar. Clumps 1 and 3 (Lis & Schilke 2003) are indicated in the figure on the left.
Current usage metrics show cumulative count of Article Views (full-text article views including HTML views, PDF and ePub downloads, according to the available data) and Abstracts Views on Vision4Press platform.
Data correspond to usage on the plateform after 2015. The current usage metrics is available 48-96 hours after online publication and is updated daily on week days.
Initial download of the metrics may take a while.