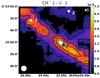
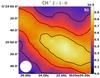
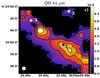
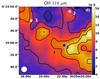
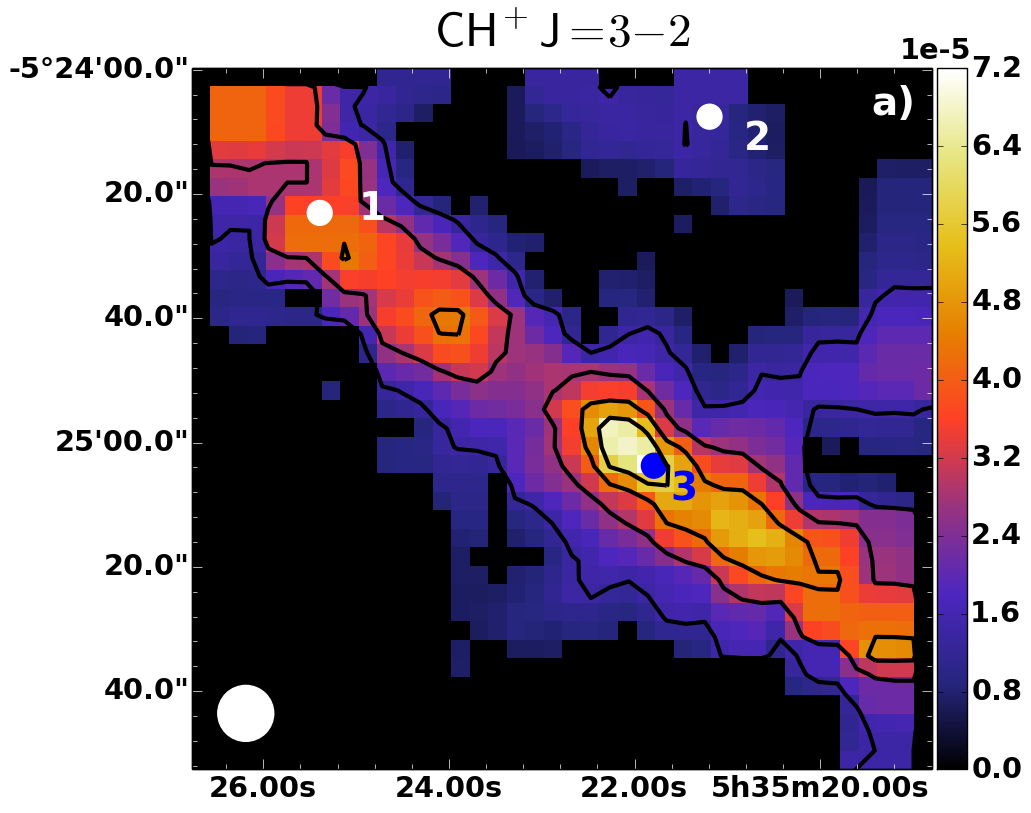
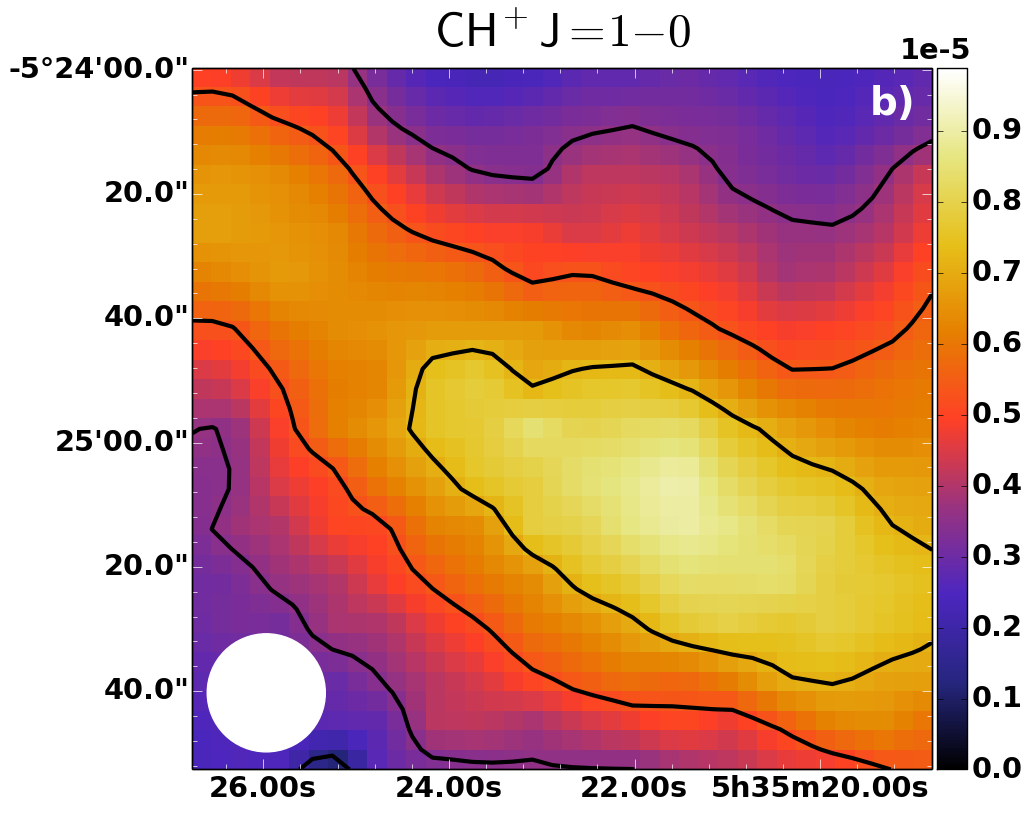
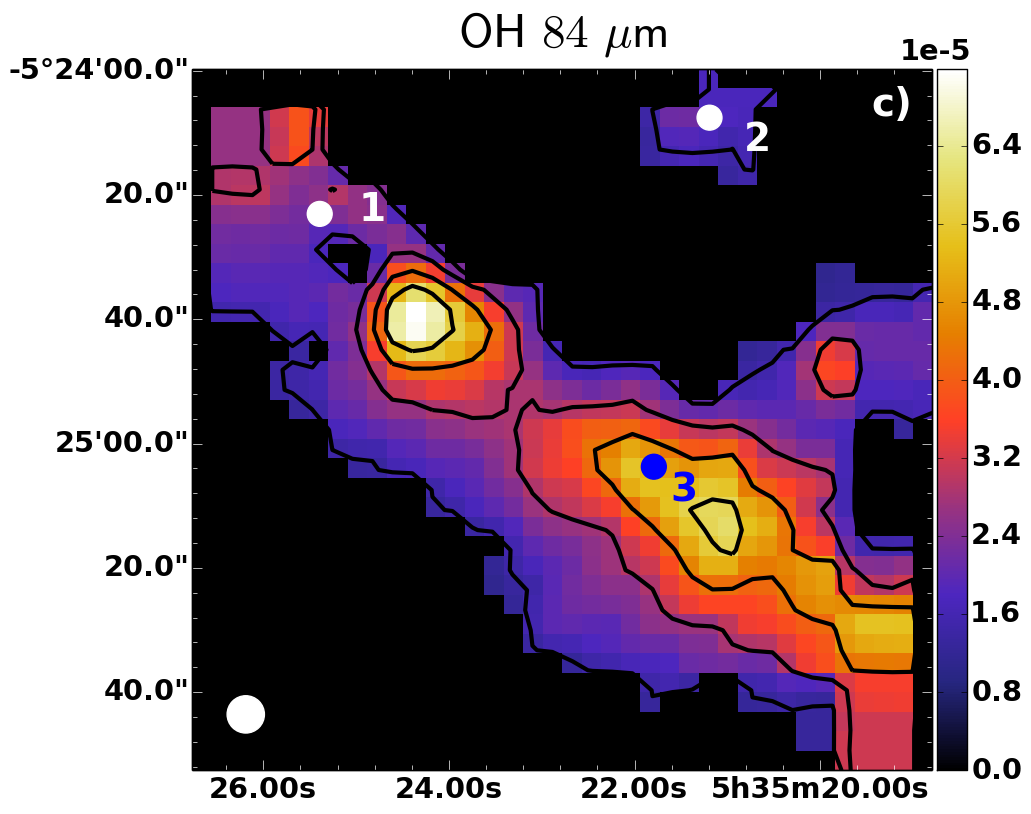
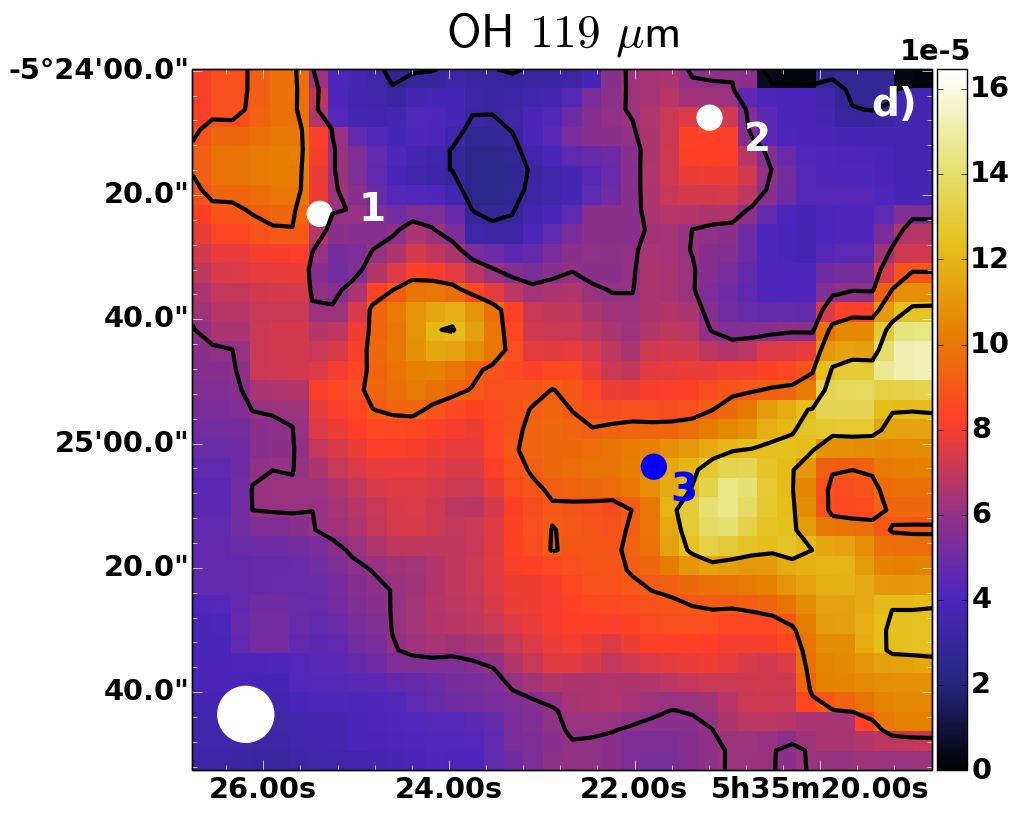
Fig. 3

Morphology of different lines: a) CH+J = 3–2; b) CH+J = 1–0; c) OH 84.6 μm; and d) OH 119.4 μm. Contours with contour steps of 20% of the peak emission in the Bar. The intensities are in units of erg s-1 cm-2 sr-1. The black pixels are pixels where lines are not detected. The beam sizes (6″ for OH 84 μm, 9″ for CH+J = 3–2 and OH 119 μm, and 19″ for CH+J = 1–0) are shown in the bottom left corner. The positions from which the spectra in Fig. 2 are also indicated in the pictures with corresponding numbers.
Current usage metrics show cumulative count of Article Views (full-text article views including HTML views, PDF and ePub downloads, according to the available data) and Abstracts Views on Vision4Press platform.
Data correspond to usage on the plateform after 2015. The current usage metrics is available 48-96 hours after online publication and is updated daily on week days.
Initial download of the metrics may take a while.