Free Access
Fig. 1
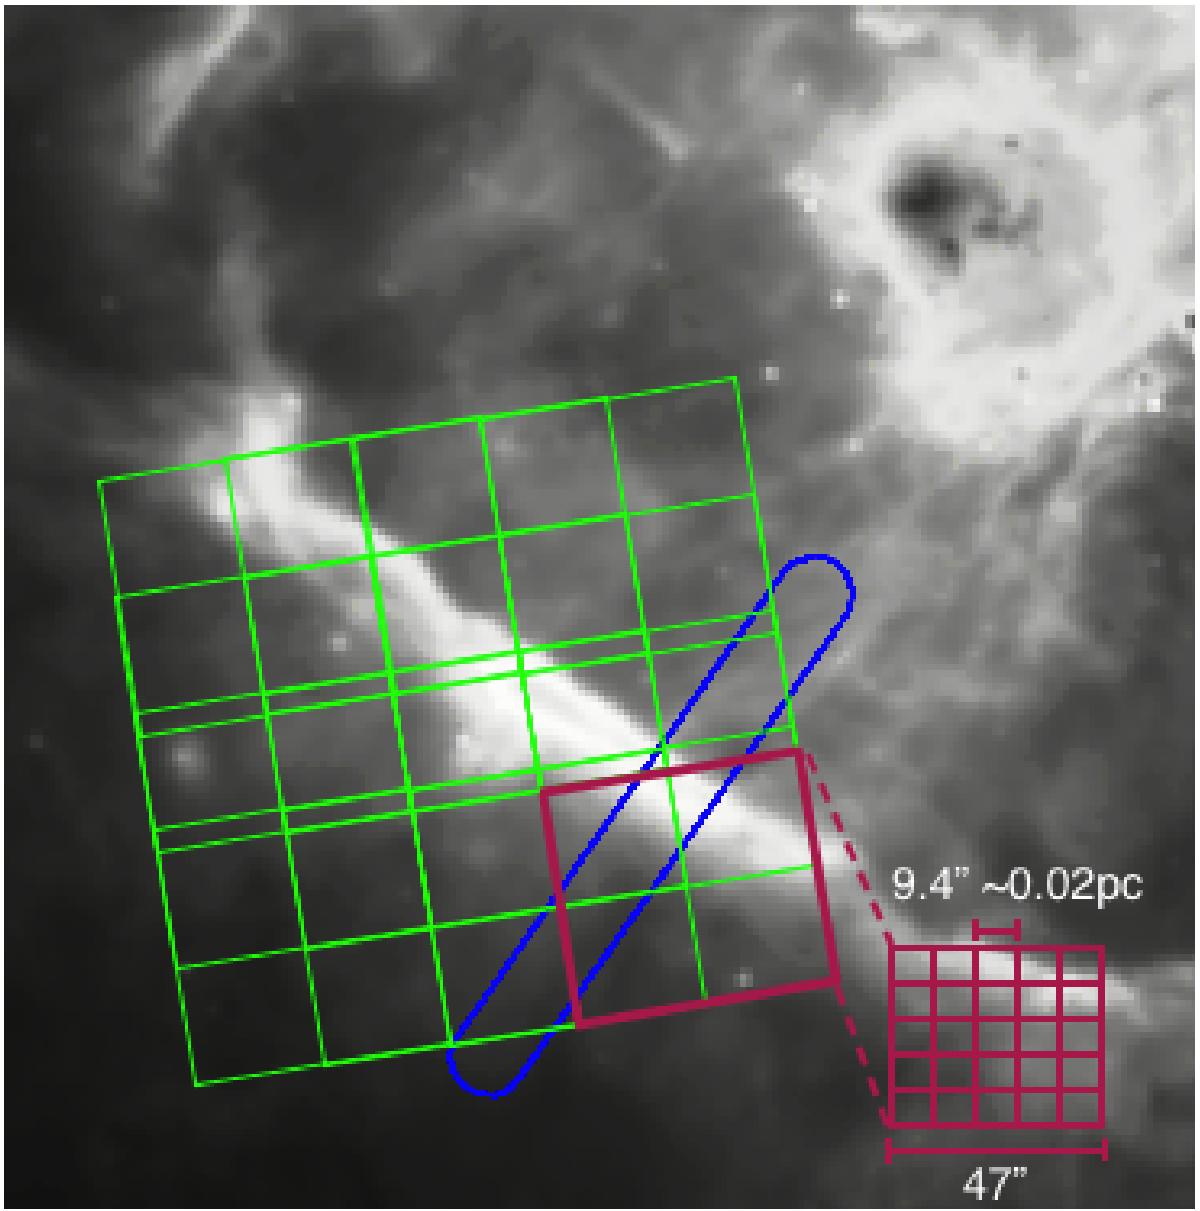
Overlay of the PACS observations and HIFI observations on a Spitzer IRAC 8 μm image of the Orion Bar. A 4 × 4 raster map of CH+J = 3–2 with 16 overlapping footprints, is shown in green and an example of a footprint is shown in red. The strip of CH+J = 2–1 is shown in blue.
Current usage metrics show cumulative count of Article Views (full-text article views including HTML views, PDF and ePub downloads, according to the available data) and Abstracts Views on Vision4Press platform.
Data correspond to usage on the plateform after 2015. The current usage metrics is available 48-96 hours after online publication and is updated daily on week days.
Initial download of the metrics may take a while.