Free Access
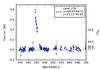
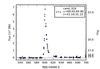
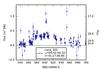
Fig. B.1
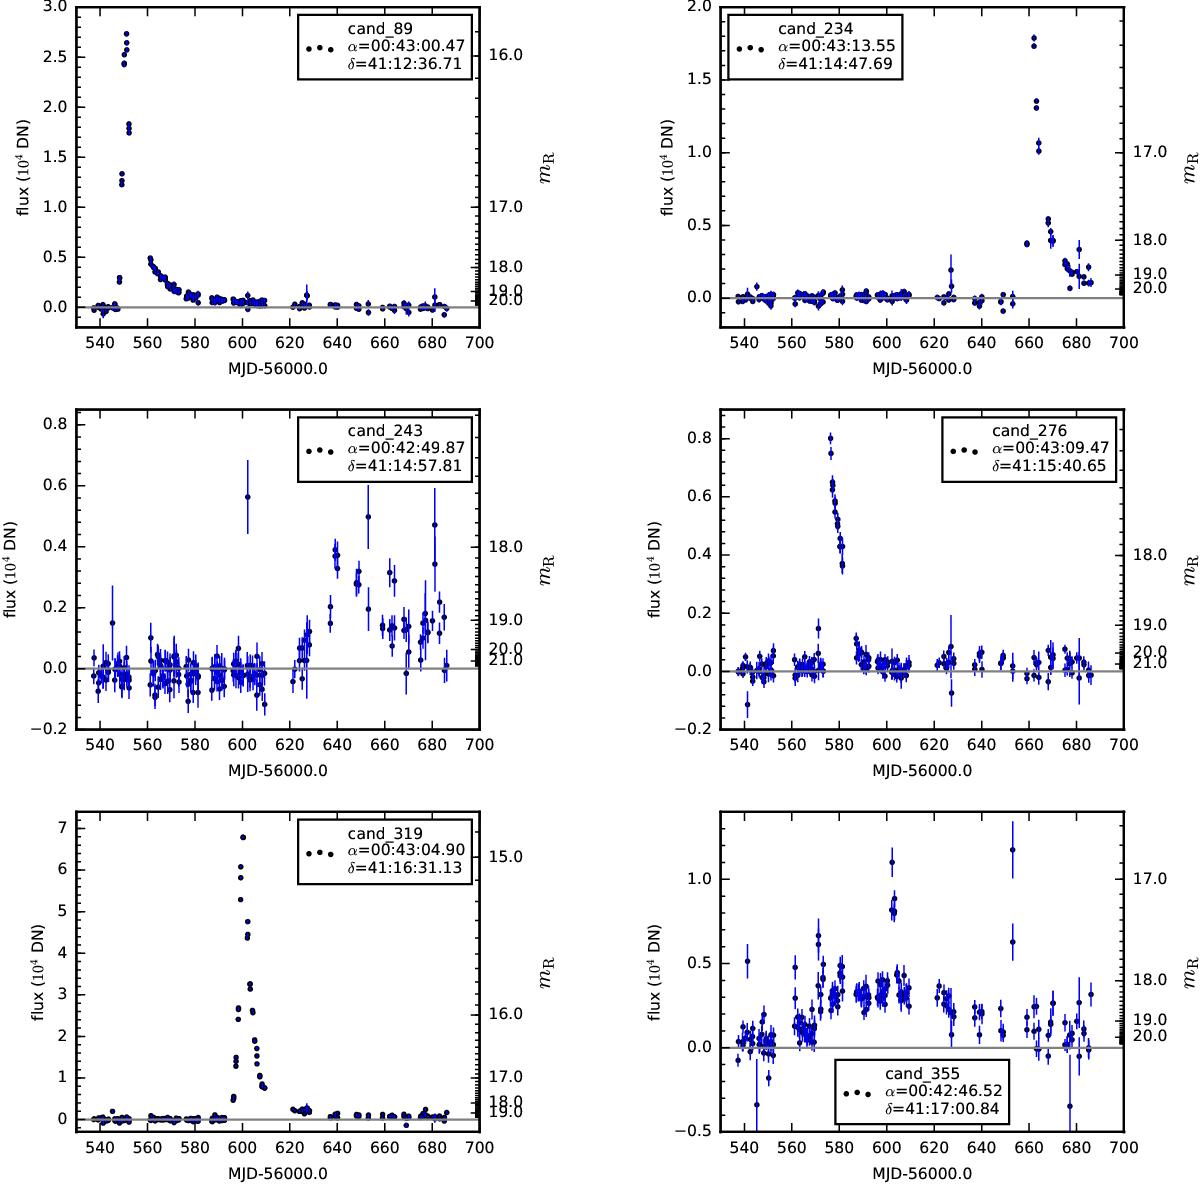
Lightcurves of the nova candidates obtained from the nova selection algorithm (see Sect. 5). The vertical axis on the right side shows the calibrated R-band magnitudes corresponding to the flux values on the left vertical axis.
This figure is made of several images, please see below:
Current usage metrics show cumulative count of Article Views (full-text article views including HTML views, PDF and ePub downloads, according to the available data) and Abstracts Views on Vision4Press platform.
Data correspond to usage on the plateform after 2015. The current usage metrics is available 48-96 hours after online publication and is updated daily on week days.
Initial download of the metrics may take a while.