Fig. 4
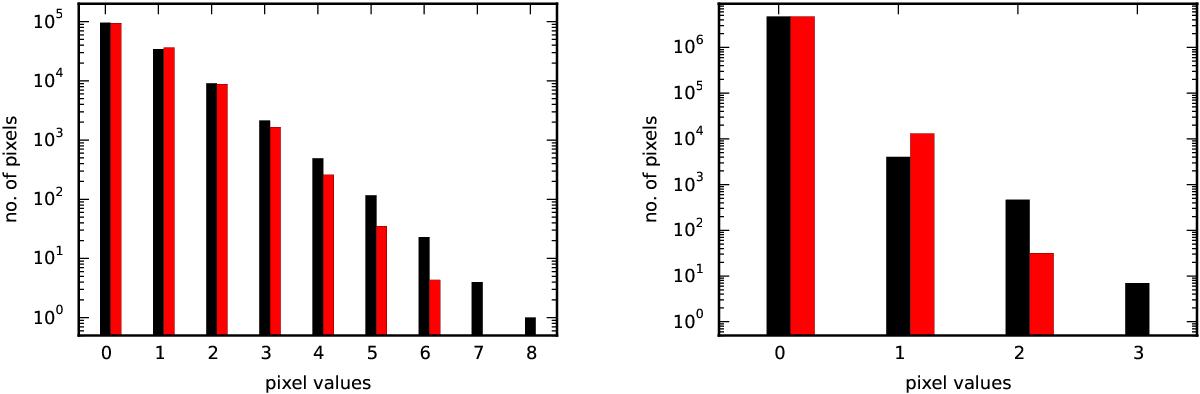
Comparison of the background pixel value distribution of the hits image, shown in black, with the distribution expected for Poissonian background, shown in red, obtained using the WAVDETECT output B′ (see Sect. 4.2), for the bulge (left) and for the disc (right). The red histograms have been shifted along the x-axis by pixel value = 0.1 for clarity.

Current usage metrics show cumulative count of Article Views (full-text article views including HTML views, PDF and ePub downloads, according to the available data) and Abstracts Views on Vision4Press platform.
Data correspond to usage on the plateform after 2015. The current usage metrics is available 48-96 hours after online publication and is updated daily on week days.
Initial download of the metrics may take a while.