Fig. 2
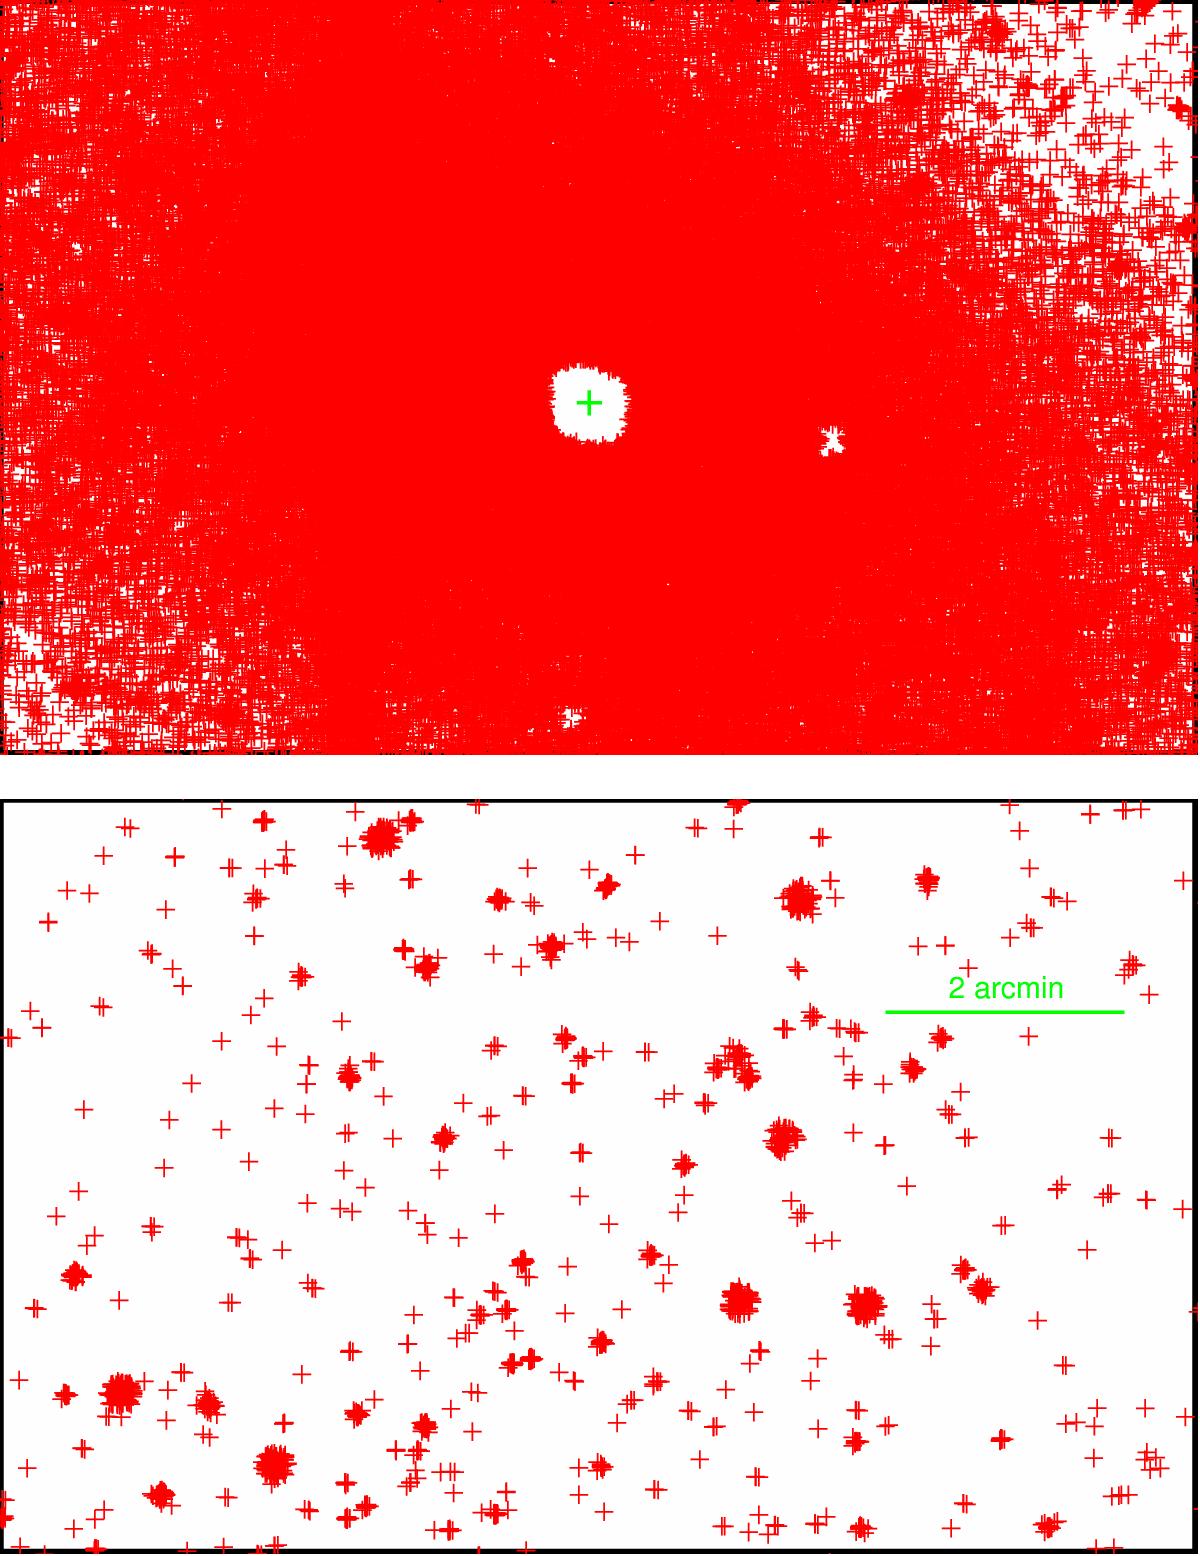
Upper panel: spatial recurrence image obtained by plotting the raw detections as red crosses (cf. Sects. 1, 3), zoomed in on the bulge of M 31. The center of M 31 is marked by the green cross. North is upward and east is left. Due to saturation close to the center of M 31, there are no sources detected by the iPTF pipeline. Lower panel: outer part of the spatial recurrence image, approximately half a degree northward of the center of M 31.

Current usage metrics show cumulative count of Article Views (full-text article views including HTML views, PDF and ePub downloads, according to the available data) and Abstracts Views on Vision4Press platform.
Data correspond to usage on the plateform after 2015. The current usage metrics is available 48-96 hours after online publication and is updated daily on week days.
Initial download of the metrics may take a while.