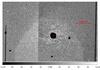
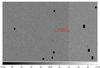
Fig. 1

Upper panel: a section of a typical M 31 difference image from the iPTF pipeline containing the bulge. Lower panel: outer part of the same difference image, approximately half a degree northward of the center of M 31. The masked areas are assigned large negative values. North is upward and east is left. The center of M 31 is marked by the red cross in the upper panel. The vertical sharp edges seen in both panels arise from the boundary of blocks that have been used to match the background before the image subtraction in the iPTF DI pipeline.
Current usage metrics show cumulative count of Article Views (full-text article views including HTML views, PDF and ePub downloads, according to the available data) and Abstracts Views on Vision4Press platform.
Data correspond to usage on the plateform after 2015. The current usage metrics is available 48-96 hours after online publication and is updated daily on week days.
Initial download of the metrics may take a while.