Fig. 7
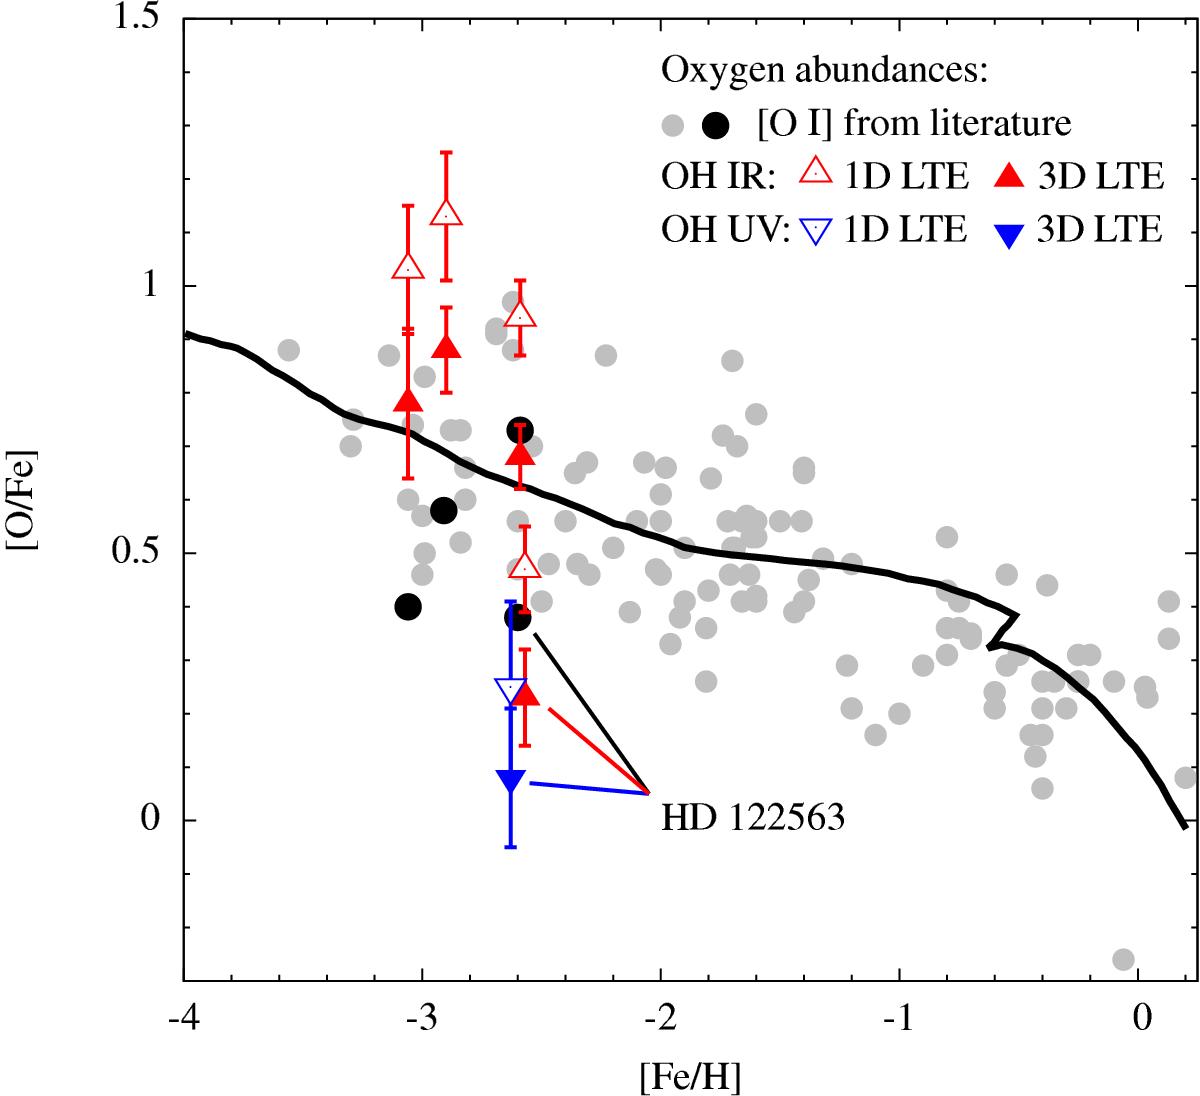
Oxygen-to-iron ratios in the Galactic metal-poor stars (following Fig. 4 from Dobrovolskas et al. 2015). Solid grey circles depict [O/Fe] ratios in red giants, subgiants, and main sequence stars determined using the forbidden [O i] 630 nm line (literature data; see Dobrovolskas et al. 2015, for details). Red triangles show 3D LTE and 1D LTE [O/Fe] ratios in four metal-poor giants obtained from OH IR lines by Dobrovolskas et al. (2015, open and filled symbols, respectively). The [O/Fe] ratios determined in these stars from [O i] line are indicated as black solid circles. Blue triangles are average [O/Fe] ratios in HD 122563 obtained in this study from 71 OH UV lines (for readability, abundances determined from OH UV and IR lines are shifted horizontally by ±0.03 dex). The solid line is the evolutionary model of François et al. (2004). Note that all abundance ratios are given in the reference scale, where the solar oxygen abundance is A(O) = 8.76 (Steffen et al. 2015).
Current usage metrics show cumulative count of Article Views (full-text article views including HTML views, PDF and ePub downloads, according to the available data) and Abstracts Views on Vision4Press platform.
Data correspond to usage on the plateform after 2015. The current usage metrics is available 48-96 hours after online publication and is updated daily on week days.
Initial download of the metrics may take a while.