Fig. 5
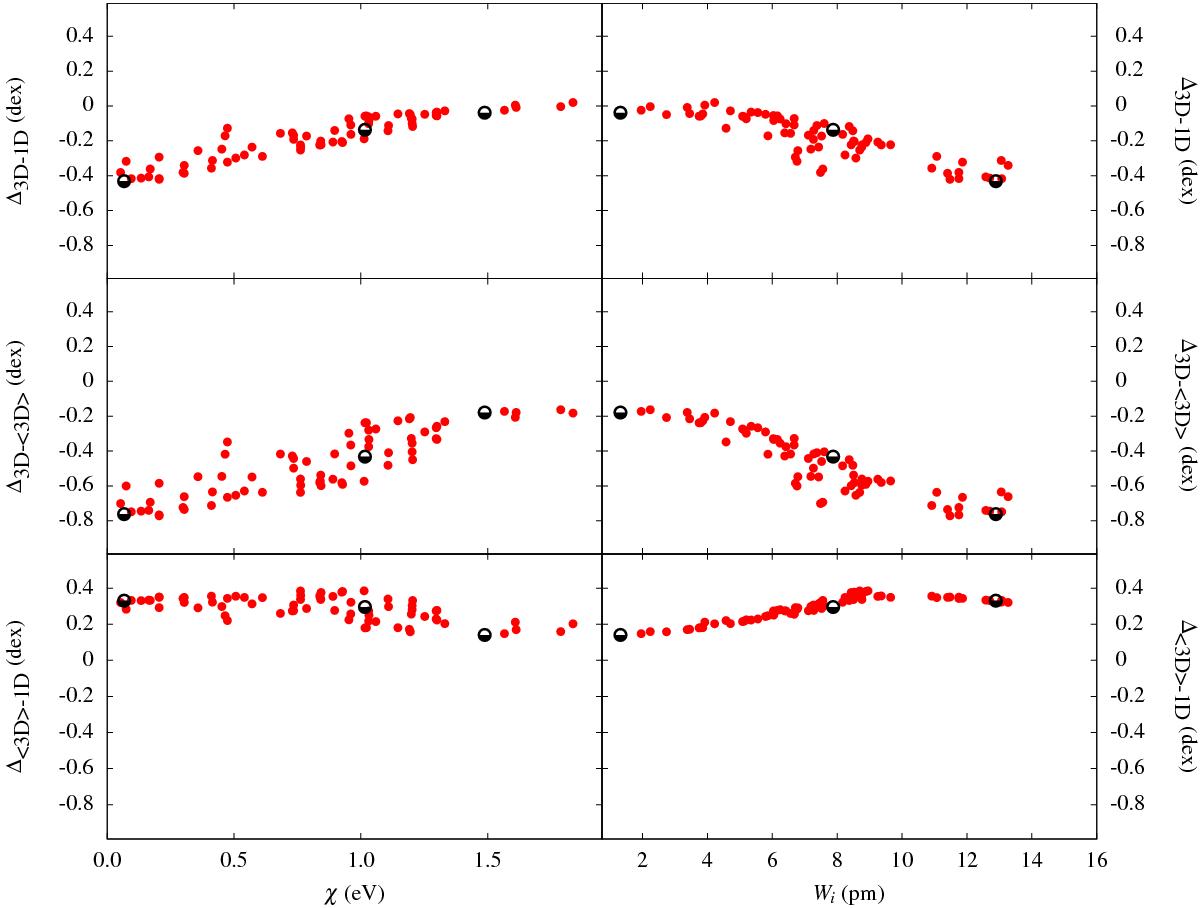
3D–1D abundance corrections as computed for individual OH UV lines: Δ3D−1D (top panels), Δ3D− ⟨ 3D ⟩ (middle panels), and Δ⟨ 3D ⟩ −1D (bottom panels) plotted versus the line excitation potential, χ (left), and line equivalent width, W (right). Red dots indicate all OH UV lines in our sample, half-filled black circles represent lines whose contribution functions are shown in Fig. 6 (see text for details). Δ⟨ 3D ⟩ −1D values are provided in Appendix A.
Current usage metrics show cumulative count of Article Views (full-text article views including HTML views, PDF and ePub downloads, according to the available data) and Abstracts Views on Vision4Press platform.
Data correspond to usage on the plateform after 2015. The current usage metrics is available 48-96 hours after online publication and is updated daily on week days.
Initial download of the metrics may take a while.