Fig. 4
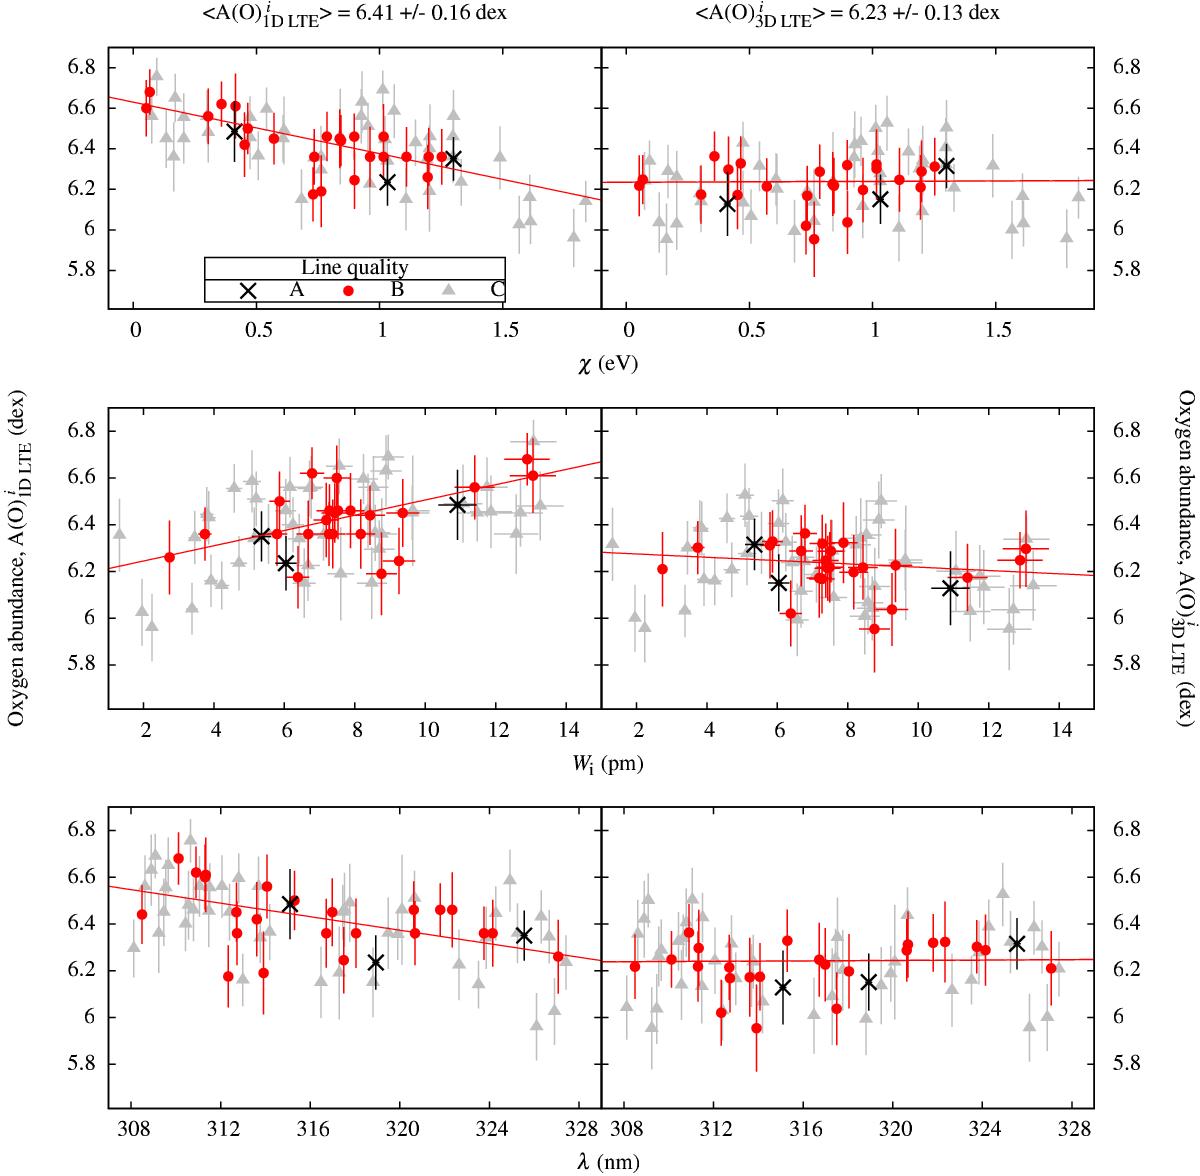
Oxygen abundances determined from the individual OH UV lines using a classical 1D (ATLAS9, left column) and corrected for 3D hydrodynamical effects using a CO5BOLD model atmosphere (right column). The top, middle, and bottom panels show A(O) plotted versus excitation potential, χ, line equivalent width, Wi, and wavelength, λ, respectively. Different symbols indicate spectral lines of different quality where A-class lines are the best/cleanest (see Sect. 2.4.1 for details). All derived abundances are provided in Appendix A.
Current usage metrics show cumulative count of Article Views (full-text article views including HTML views, PDF and ePub downloads, according to the available data) and Abstracts Views on Vision4Press platform.
Data correspond to usage on the plateform after 2015. The current usage metrics is available 48-96 hours after online publication and is updated daily on week days.
Initial download of the metrics may take a while.