Fig. 1
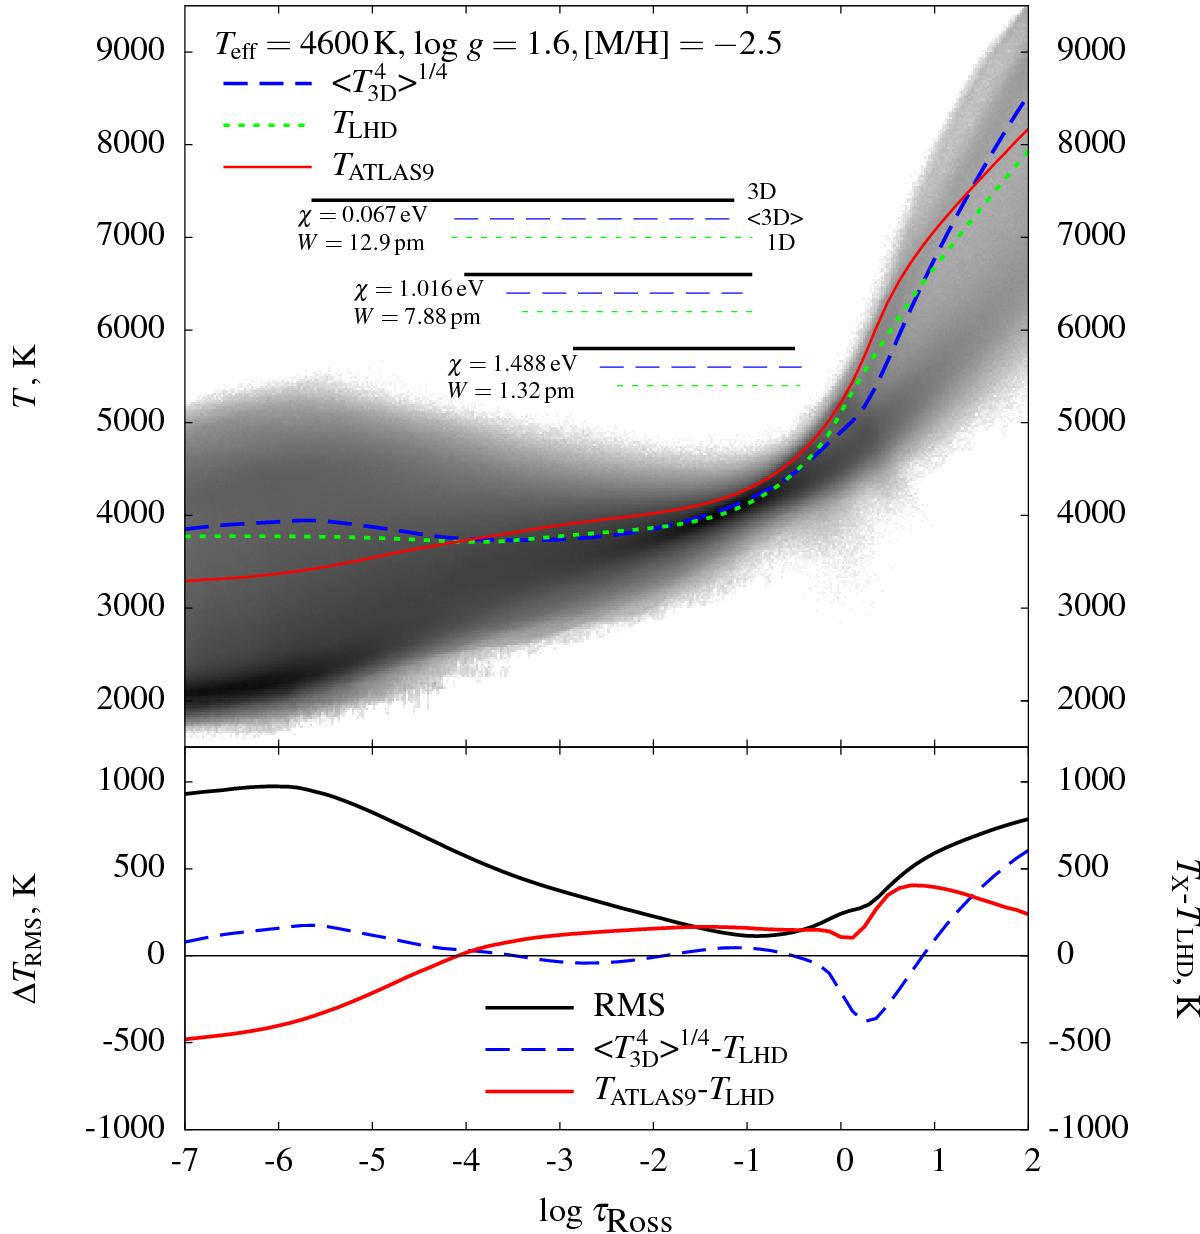
Top: temperature structure of the 3D hydrodynamical (greyscale map of the logarithmic temperature probability density), average ⟨3D⟩ (blue dashed line), and 1D LHD (green dotted line) model atmospheres of HD 122563. For comparison, we also show the temperature profile of the ATLAS9 model atmosphere (red solid line). Horizontal bars indicate the optical depth intervals where 90% of the equivalent width (i.e., between 5% and 95%) of three representative OH lines is formed in the 3D hydrodynamical (black solid bar), average ⟨3D⟩ (blue dashed bar), and 1D LHD (green dotted bar) model atmospheres (spectral line parameters are given next to each set of horizontal bars). Bottom: RMS value of horizontal temperature fluctuations in the 3D model (black solid line, ΔTRMS), temperature difference between the average ⟨3D⟩ and 1D models, ![]() (blue dashed line), and temperature difference between the ATLAS9 and LHD model atmospheres (red solid line).
(blue dashed line), and temperature difference between the ATLAS9 and LHD model atmospheres (red solid line).
Current usage metrics show cumulative count of Article Views (full-text article views including HTML views, PDF and ePub downloads, according to the available data) and Abstracts Views on Vision4Press platform.
Data correspond to usage on the plateform after 2015. The current usage metrics is available 48-96 hours after online publication and is updated daily on week days.
Initial download of the metrics may take a while.