Fig. 6
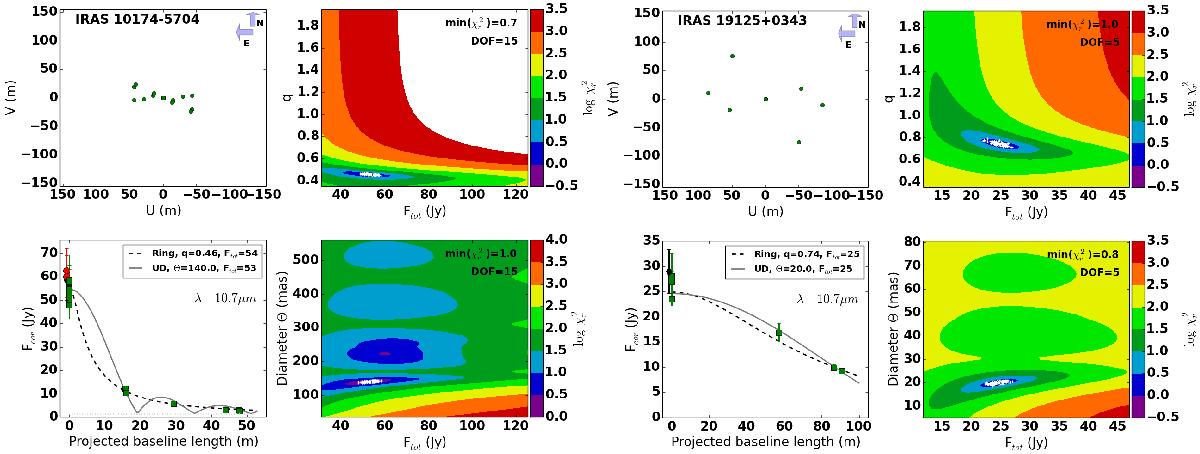
Results of the interferometric fit for two sources, IRAS 10174-5704 (left) and IRAS 19125+0343 (right). The former is an outlier in our sample, while the latter is a typical and representative source. For each figure, the left panels show the 2D uv-coverage (upper) and the corresponding correlated fluxes as a function of projected baseline length (lower), respectively. The right panels show χ2-maps for the two models used in this paper, a uniform disk (upper) and the semi-physical disk model (lower). The minimum reduced χ2 and the degrees-of-freedom are indicated in the upper right corner of both panels. The white crosses in both χ2-maps are 100 random realisations of the posterior probability distribution that was sampled by the MCMC chain. The final adopted values are indicated with a white dot. Visibility curves corresponding to these final parameter values are included in the lower left panel as the full grey and black dashed lines for the uniform disk and semi-physical disk model, respectively.
Current usage metrics show cumulative count of Article Views (full-text article views including HTML views, PDF and ePub downloads, according to the available data) and Abstracts Views on Vision4Press platform.
Data correspond to usage on the plateform after 2015. The current usage metrics is available 48-96 hours after online publication and is updated daily on week days.
Initial download of the metrics may take a while.