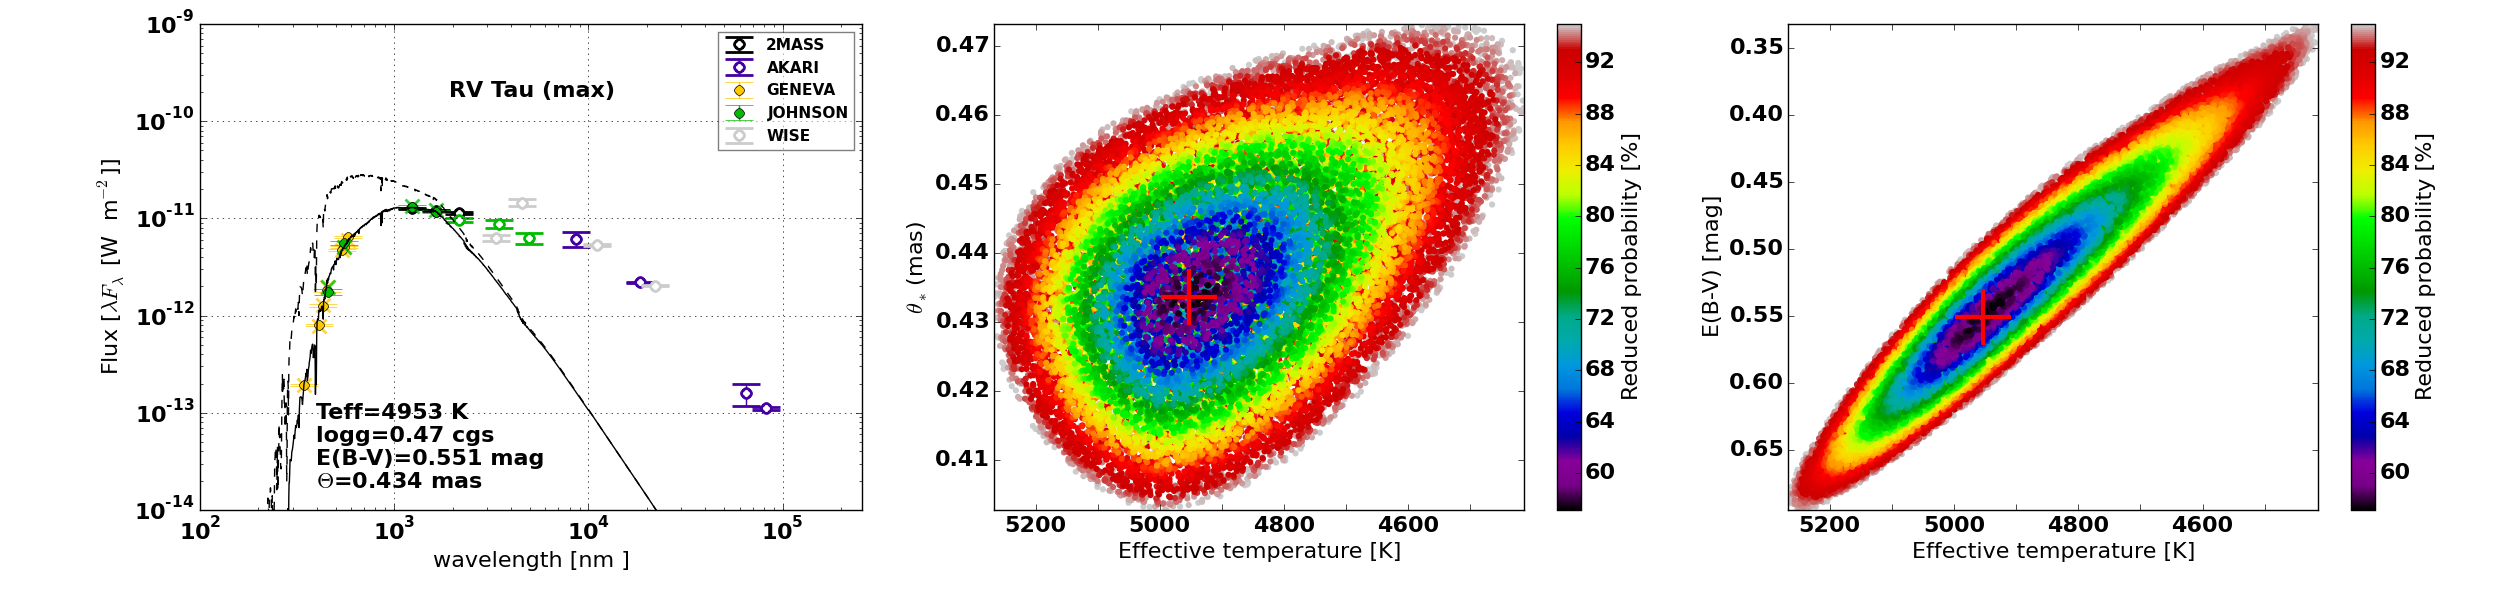
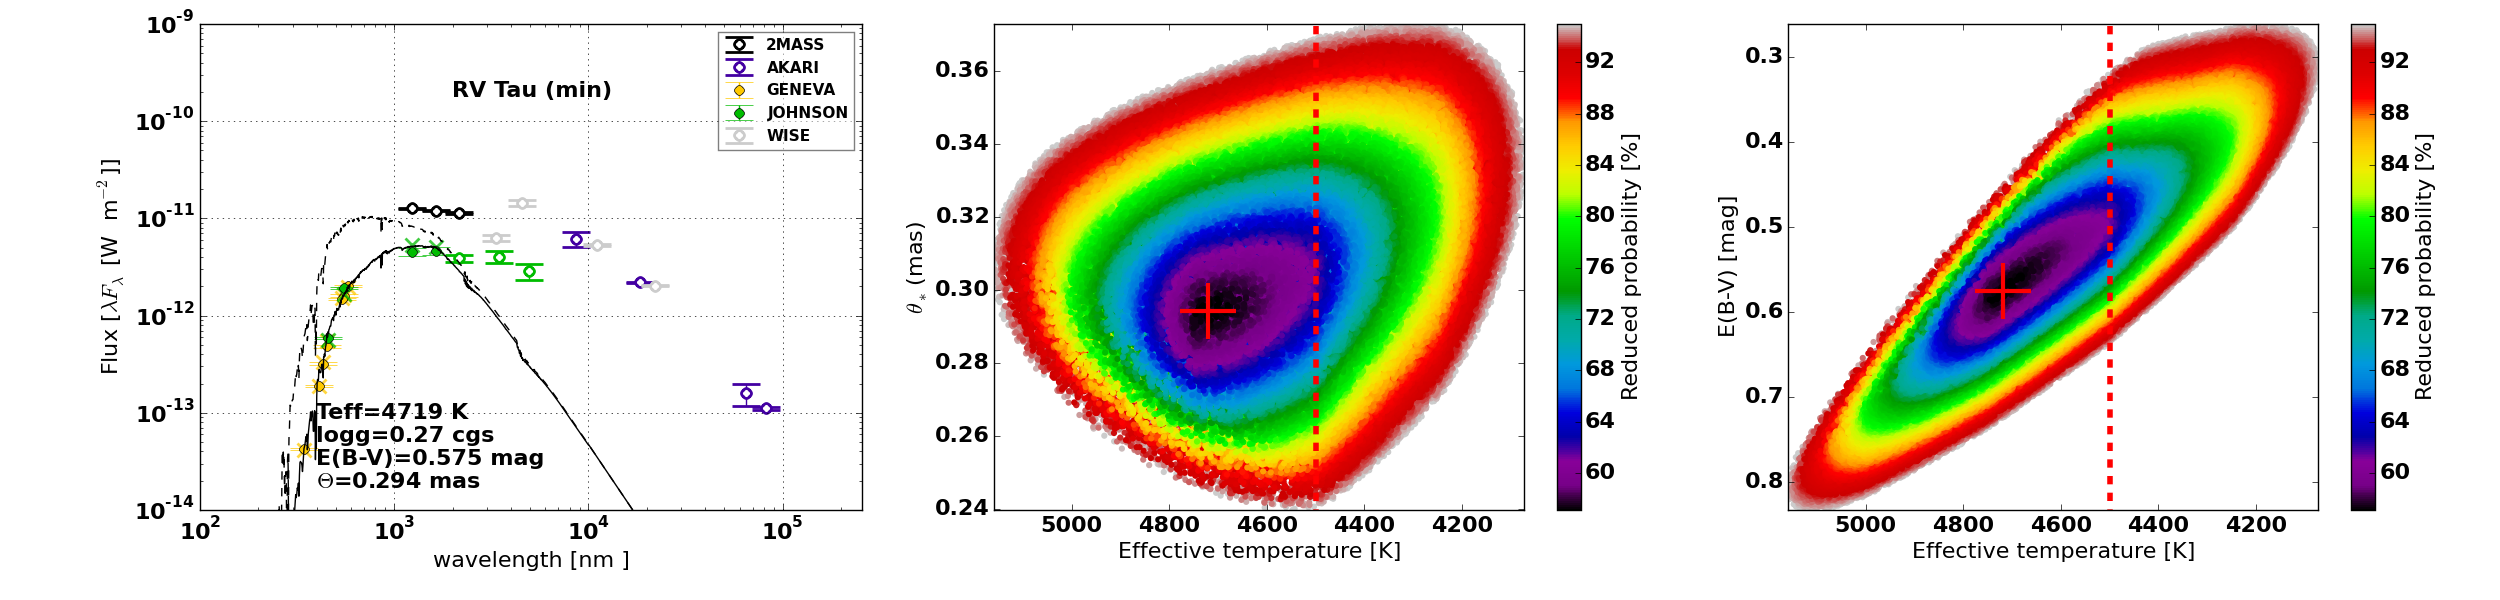
Fig. 3
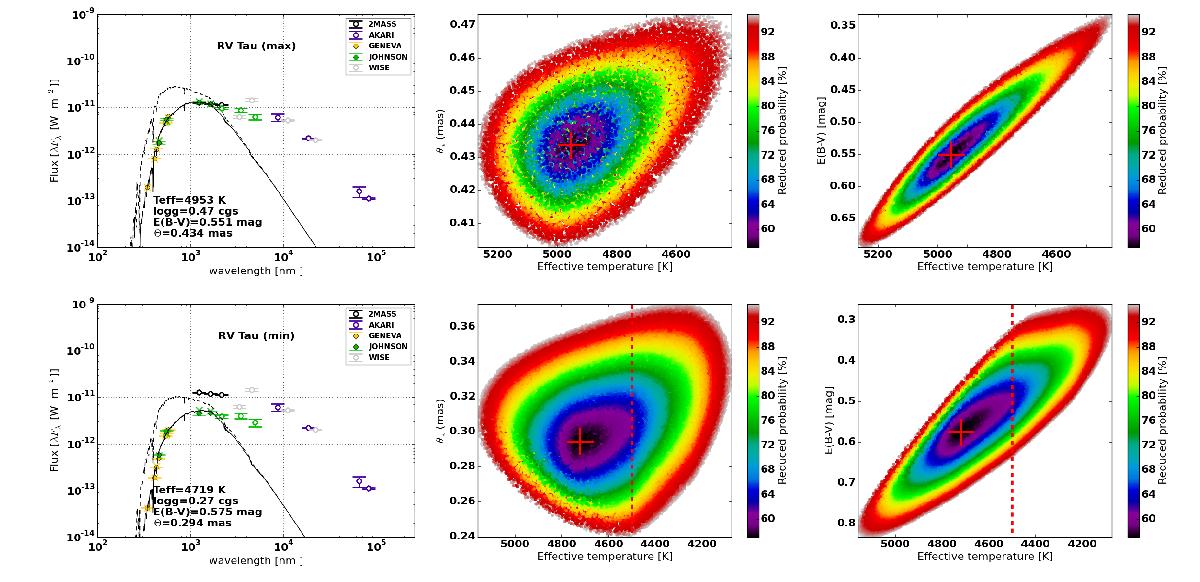
Same as Fig. 2 but for a post-AGB star with strong pulsational variability (RV Tau itself). The upper and lower panels show optical and near-IR photometry at visual maximum and minimum pulsation phases, respectively. For visual reference we also include photometry for which no proper phase attribution can be made (mainly Tycho-2, 2MASS, and all mid- and far-IR data). In some cases these data may correspond to a different RVb phase.
Current usage metrics show cumulative count of Article Views (full-text article views including HTML views, PDF and ePub downloads, according to the available data) and Abstracts Views on Vision4Press platform.
Data correspond to usage on the plateform after 2015. The current usage metrics is available 48-96 hours after online publication and is updated daily on week days.
Initial download of the metrics may take a while.