Fig. 2
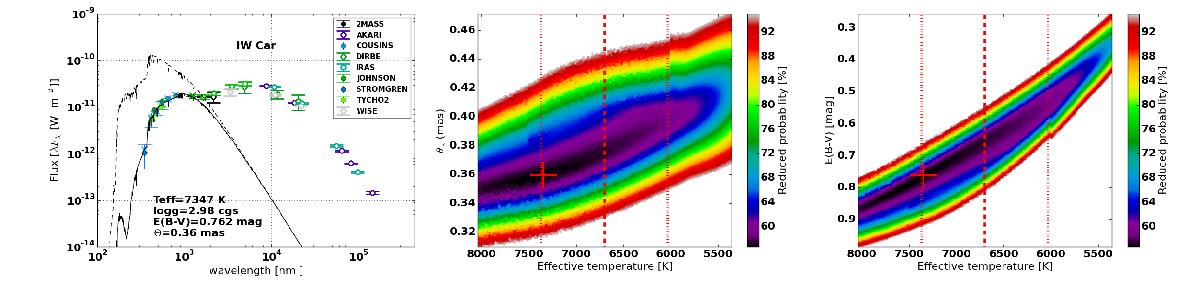
An example (IW Car) of an SED of a post-AGB star with negligible pulsational variability. Left panel: measured photometry (circles), which are filled if the data were used in the fitting process. The colour indicates the photometric system, as listed in the legend. The full black line is the best-fit SED model that abides the spectroscopic temperature constraint (see the red cross in the middle and right panels). The exact parameter values of this model are given in the figure. The dashed black line is the same model, but unreddened. A consistent vertical scale, and colour coding for the photometric systems, is used for all stars in the sample (see Appendix B). Middle panel: confidence interval of the angular diameter θ⋆ vs. the effective temperature Teff. The dashed red line corresponds to the spectroscopically measured effective temperature. The dotted red lines indicate the 3σ lower and upper limit on this temperature. Right panel: confidence interval of the reddening E(B−V) vs. the effective temperature Teff.
Current usage metrics show cumulative count of Article Views (full-text article views including HTML views, PDF and ePub downloads, according to the available data) and Abstracts Views on Vision4Press platform.
Data correspond to usage on the plateform after 2015. The current usage metrics is available 48-96 hours after online publication and is updated daily on week days.
Initial download of the metrics may take a while.