Free Access
Fig. 12
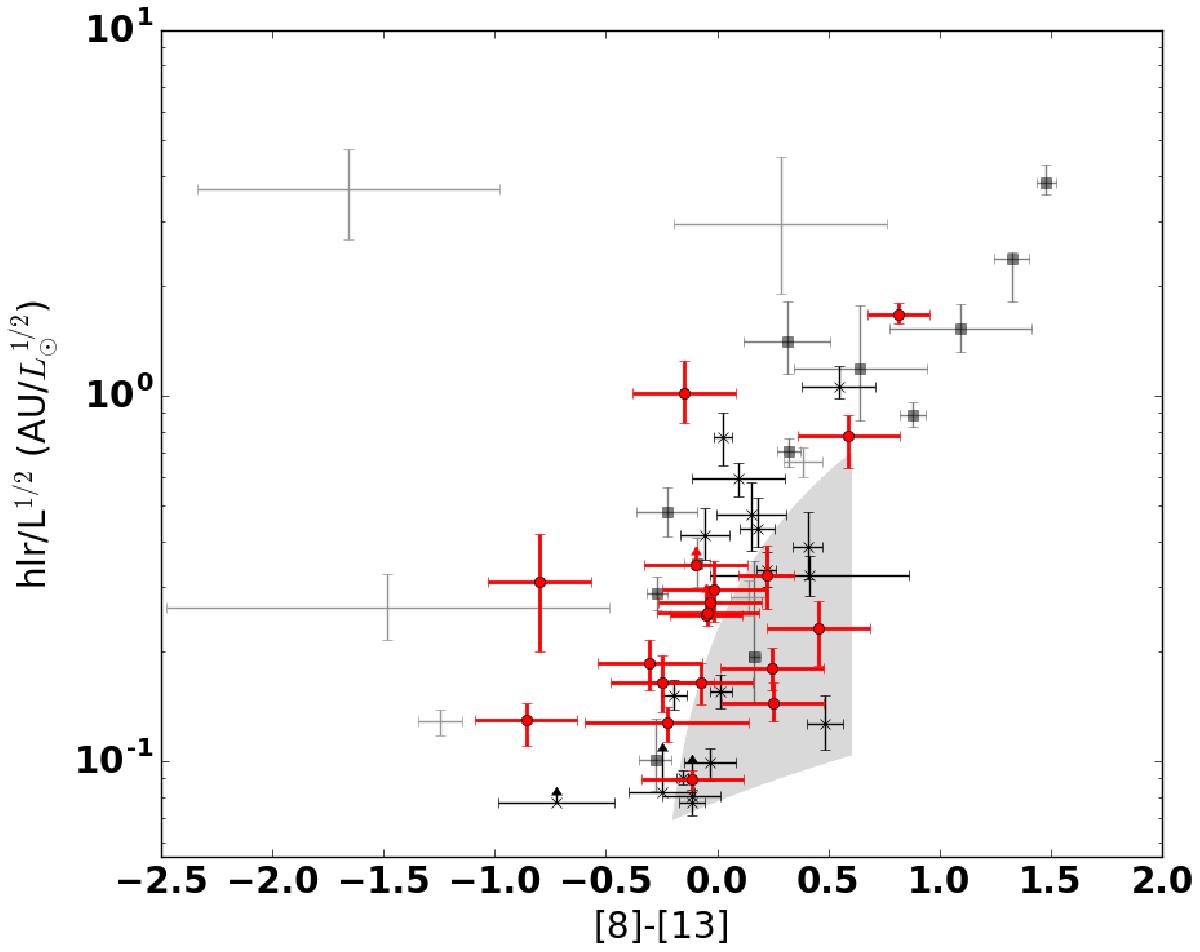
Size-colour diagram of our sample of post-AGB stars compared to the sample of Herbig Ae disks that was studied by Menu et al. (2015). Arrows indicate upper limits. The symbols are explained in Sect. 8.3. The grey area delimits the region of continuous HAEBE disk models computed by Menu et al. (2015).
Current usage metrics show cumulative count of Article Views (full-text article views including HTML views, PDF and ePub downloads, according to the available data) and Abstracts Views on Vision4Press platform.
Data correspond to usage on the plateform after 2015. The current usage metrics is available 48-96 hours after online publication and is updated daily on week days.
Initial download of the metrics may take a while.