Fig. 10
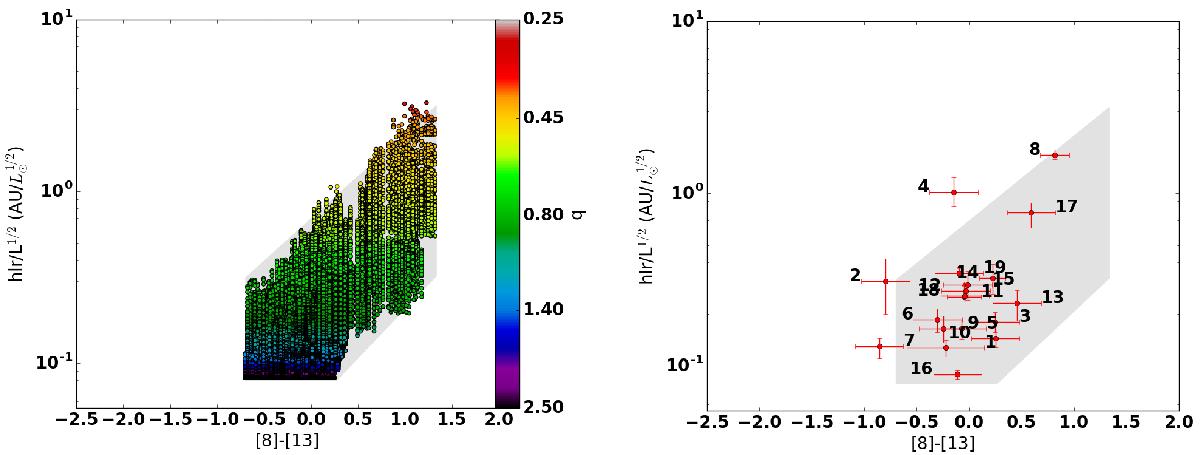
Left: size-colour diagram with the distribution of observables computed for all models in the radiative transfer grid (i.e., one point corresponds to one combination of MCMax disk parameters and one baseline length+orientation). The colour coding is according to the q-value of the fit. Right: the location of the post-AGB disk stars within the range of models, shown as grey-shaded region.
Current usage metrics show cumulative count of Article Views (full-text article views including HTML views, PDF and ePub downloads, according to the available data) and Abstracts Views on Vision4Press platform.
Data correspond to usage on the plateform after 2015. The current usage metrics is available 48-96 hours after online publication and is updated daily on week days.
Initial download of the metrics may take a while.