Fig. 1
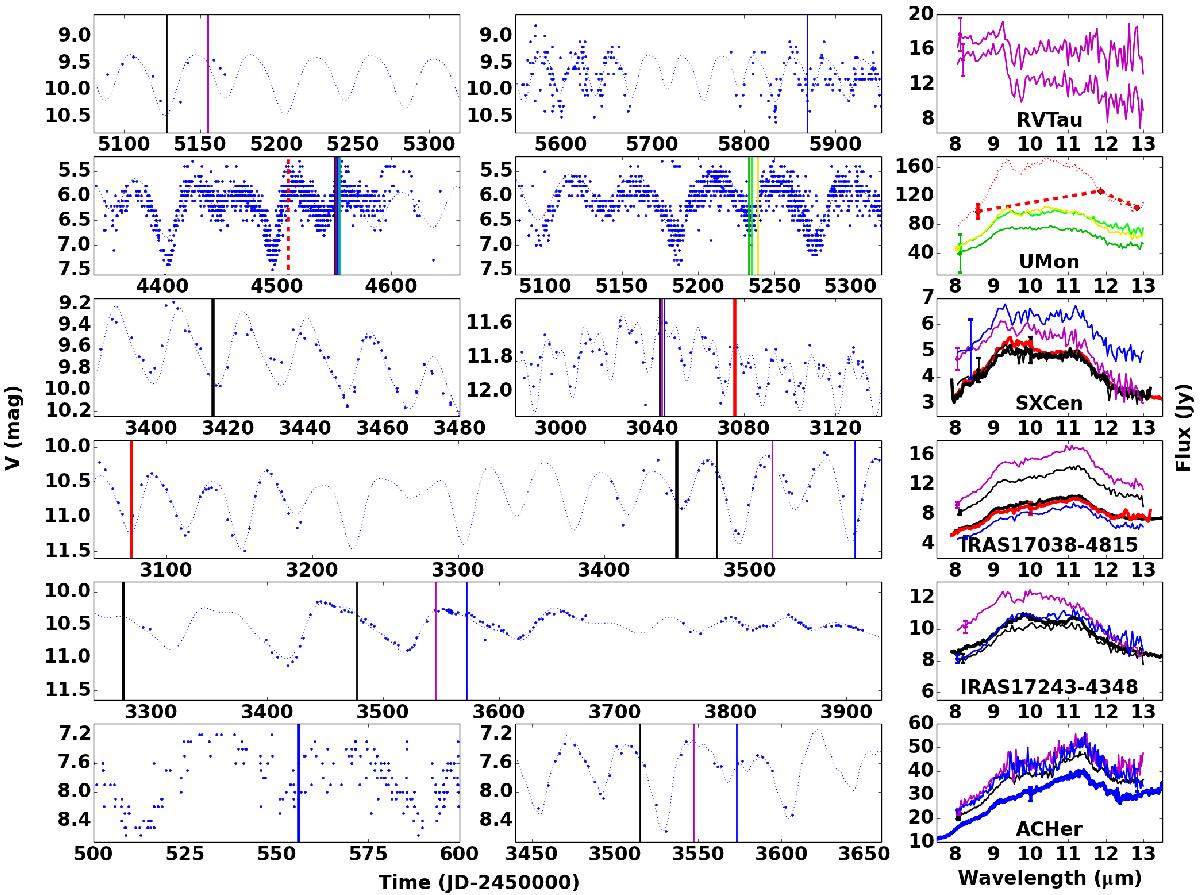
Left panels: AAVSO and ASAS V band light curves of the six stars with pulsation-related flux variations larger than 0.5 mag. The blue dotted line is a fit to the full light curve as described in Sect. 3.3, only shown to guide the eye. The coloured vertical lines indicate the time of observation of the mid-IR spectra shown in the right panels. Thick black, thick blue and thick red lines represent data from Spitzer, ISO and Timmi2, respectively. The thick red dashed line indicates the three-filter VISIR photometry of U Mon (published by Lagadec et al. 2011). The thin coloured lines represent our MIDI measurements at various epochs. Right panels: measured mid-IR fluxes for the indicated epochs in the left panels. The minimum error over the shown wavelength range is indicated for each spectrum with a bar. For RV Tau and U Mon, a few very noisy MIDI spectra are not included in the right panel. The red dotted line in the right panel of U Mon is the orange spectrum scaled to the VISIR fluxes.
Current usage metrics show cumulative count of Article Views (full-text article views including HTML views, PDF and ePub downloads, according to the available data) and Abstracts Views on Vision4Press platform.
Data correspond to usage on the plateform after 2015. The current usage metrics is available 48-96 hours after online publication and is updated daily on week days.
Initial download of the metrics may take a while.