Fig. 9
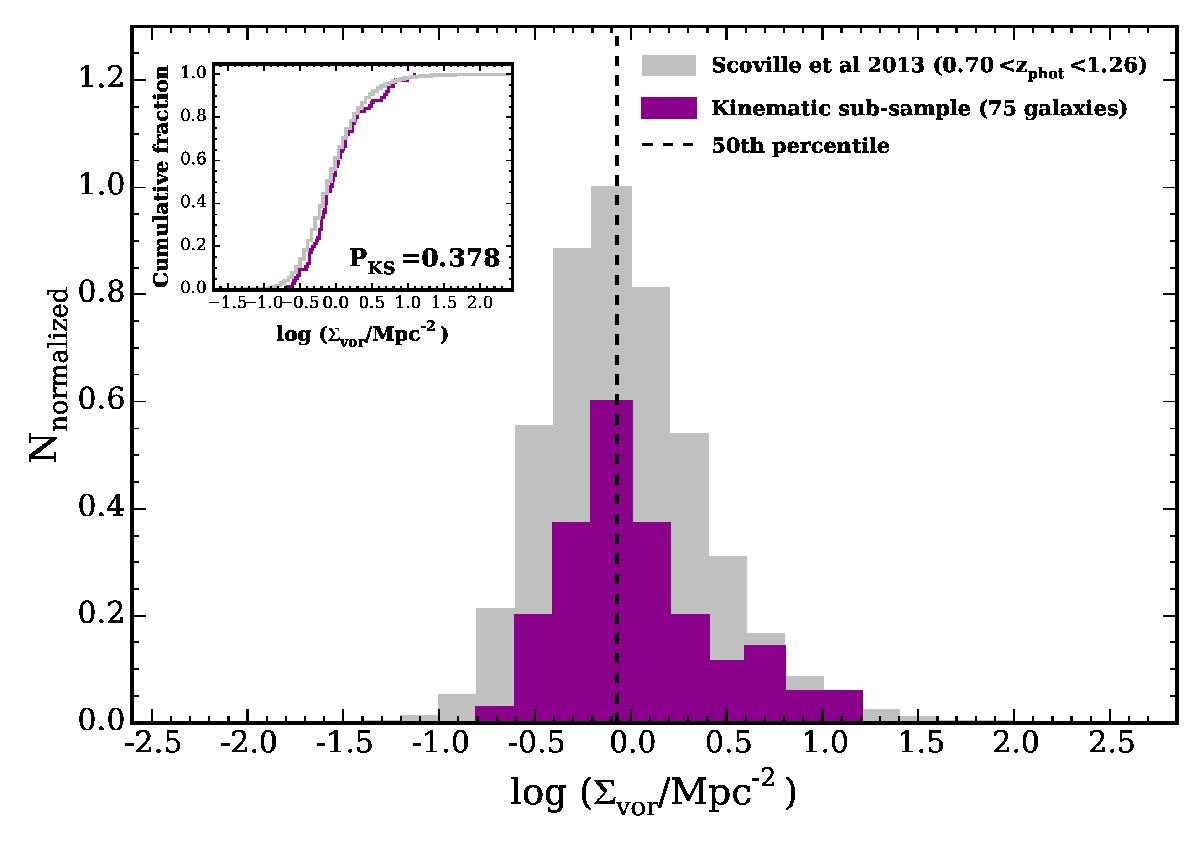
Local density distributions. The gray histogram represents the distribution of log 10(Σvor/ Mpc2) for the parent galaxy sample from Scoville et al. (2013) at 0.75 <z< 1.2. The purple histogram shows the density distribution of our sample. Both histograms are re-normalized for a better visual comparison of their spreads and peaks, therefore their normalization does not reflect the actual scale. The vertical line splits in half the parent local density distribution, to define the low- (to the left) and the high- (to the right) density environments. The plot embedded shows the comparison of the two cumulative distributions of both samples with the resulting value from the K-S test.
Current usage metrics show cumulative count of Article Views (full-text article views including HTML views, PDF and ePub downloads, according to the available data) and Abstracts Views on Vision4Press platform.
Data correspond to usage on the plateform after 2015. The current usage metrics is available 48-96 hours after online publication and is updated daily on week days.
Initial download of the metrics may take a while.