Fig. 3
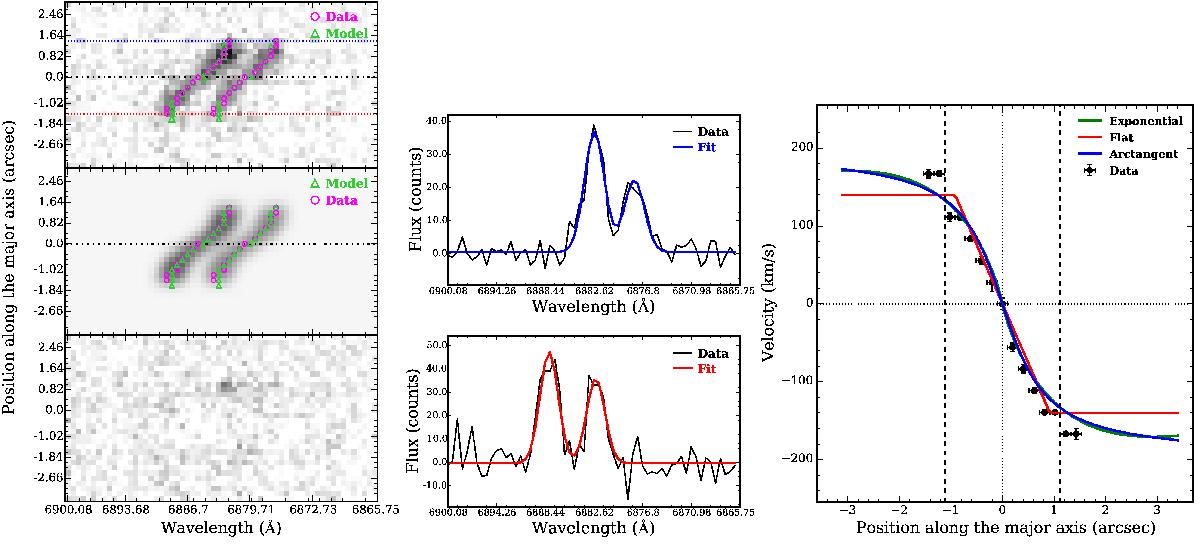
Example of the output from the model-fitting process and the vision inspections to test the quality of the fit. Left panels: from top to bottom: continuum-subtracted 2D spectrum centered at [OII], best-fit kinematic model to the line emission, and residual image between the 2D spectrum and the best-fit model on the same intensity scale as the 2D spectrum. The vertical and horizontal axes are the spatial position and wavelength, respectively. In the first two panels, the black dot-dashed lines indicate the best-fit parameter rcen. In the top panel, the blue and red dotted lines denote the positions from where the plots in the middle panels are extracted. The 2D spectrum from the VIMOS mask has been rotated to have always the North direction in the top. For this reason the wavelength direction is opposite to the conventional representation with values increasing (getting redder) towards left. The technique of tracing the emission line as a function of the position (see text Sect. 3.2) is also shown in the top and middle pannels. Fuchsia circles show the central wavelength of the emission line at each position, and the green triangles show the centroids of the best-fit model. Middle panels: examples of the double Gaussian fit to measure the centroids of the emission line at two most external galaxy radii. Right panel: high-resolution rotation curve models (green line: exponential disc; red line: flat model; blue line: arctangent function), not corrected for the inclination, compared to the observed rotation curve (black circles). The errorbars on the y-axis direction represent the uncertainties of the fit to the line at each position to recover the centroid; the bars on the position direction indicate the bin size. The vertical dotted line indicates the galaxy rotation center, the horizontal dotted line indicates the systemic velocity, and the two vertical dashed lines indicates the position of the radius R2.2 at which the velocity is measured to derive the scaling relations (Sect. 4.1).
Current usage metrics show cumulative count of Article Views (full-text article views including HTML views, PDF and ePub downloads, according to the available data) and Abstracts Views on Vision4Press platform.
Data correspond to usage on the plateform after 2015. The current usage metrics is available 48-96 hours after online publication and is updated daily on week days.
Initial download of the metrics may take a while.