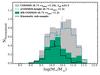
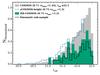
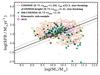
Fig. 2
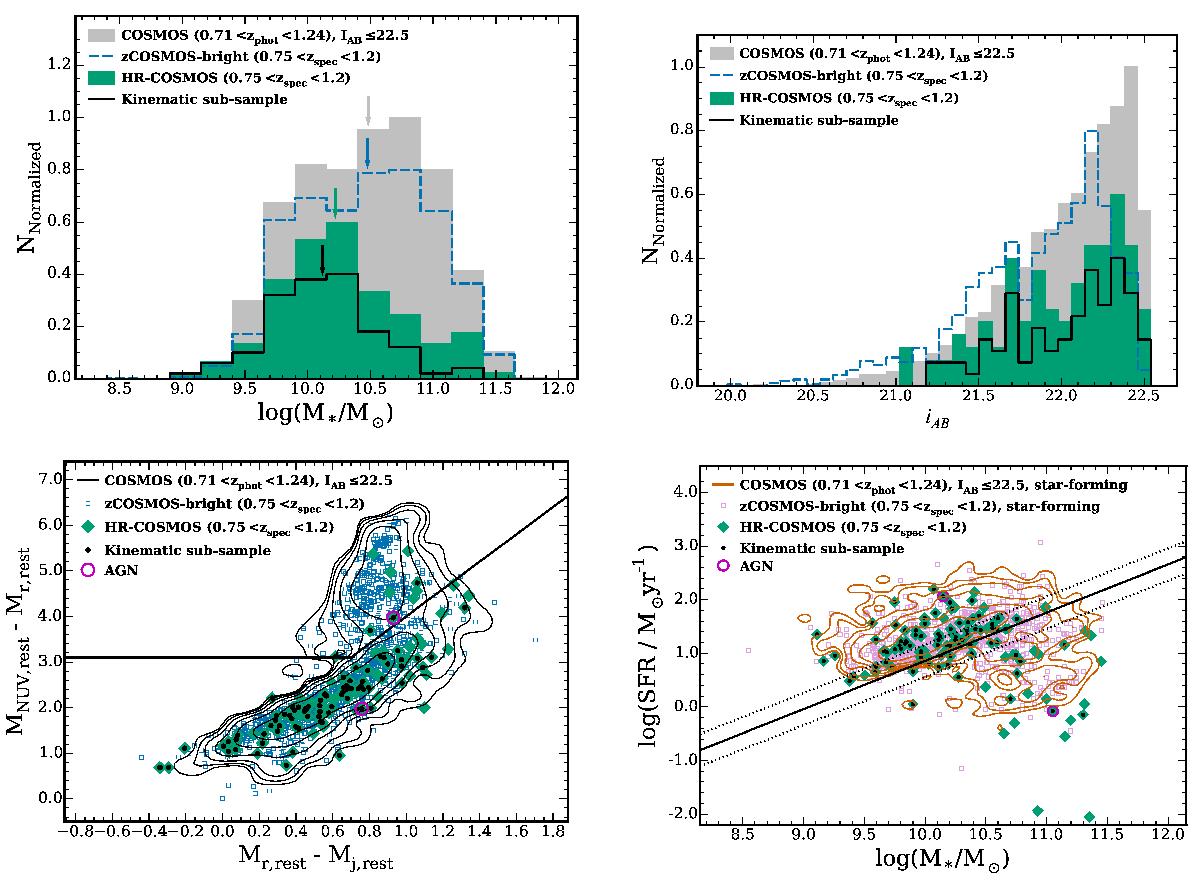
Top panels: stellar mass (left) and IAB selection magnitude (right) distributions of the 119 galaxies in our sample at 0.75 <z< 1.2 (green histograms). We show for comparison the distributions of the parent samples in the same redshift range (COSMOS in gray and zCOSMOS-bright in blue) and in black the distribution of 82 galaxies in our kinematic sub-sample (see Sect. 4.1). The photometric redshift range for the COSMOS sample takes into account the precision of the measurements (see text Sect. 2.4). The arrows in the left panel show the median of each distribution. The histograms are re-normalized for a better visual comparison of their spreads and peaks, therefore their normalization does not reflect the actual scale. Bottom left panel: rest-frame MNUV−Mr versus Mr−MJ color–color diagram. Colors are the same as in the top panels. The contours show the distribution of the COSMOS parent sample with relative number of galaxies equal to 50%, 25%, 13%, 6%, 3%, 1.5% of the maximum of the distribution. The back solid line divides quiescent galaxies (above the line) from star-forming galaxies (below the line) and is determined following the technique adopted by Ilbert et al. (2013). Bottom right panel: relationship between SED-derived star formation rate (SFR) and stellar mass. Green diamonds and black points represent the galaxies at 0.75 <z< 1.2 in our full sample and in our kinematic sub-sample, respectively. The dark-orange contours and the plum open squares show the distribution for the star-forming galaxies (as defined by Laigle et al. 2016) in COSMOS and zCOSMOS-bright samples, respectively. The contours represent the relative number of galaxies at the 50%, 25%, 13%, 6%, 3%, 1.5% of the maximum of the distribution. The solid and dotted lines represent the correlation, with the uncertainties, between the SFR and stellar mass of blue star-forming galaxies at 0.8 <z< 1.2 by Elbaz et al. (2007). The magenta circles show the AGNs.
Current usage metrics show cumulative count of Article Views (full-text article views including HTML views, PDF and ePub downloads, according to the available data) and Abstracts Views on Vision4Press platform.
Data correspond to usage on the plateform after 2015. The current usage metrics is available 48-96 hours after online publication and is updated daily on week days.
Initial download of the metrics may take a while.