Fig. B.1
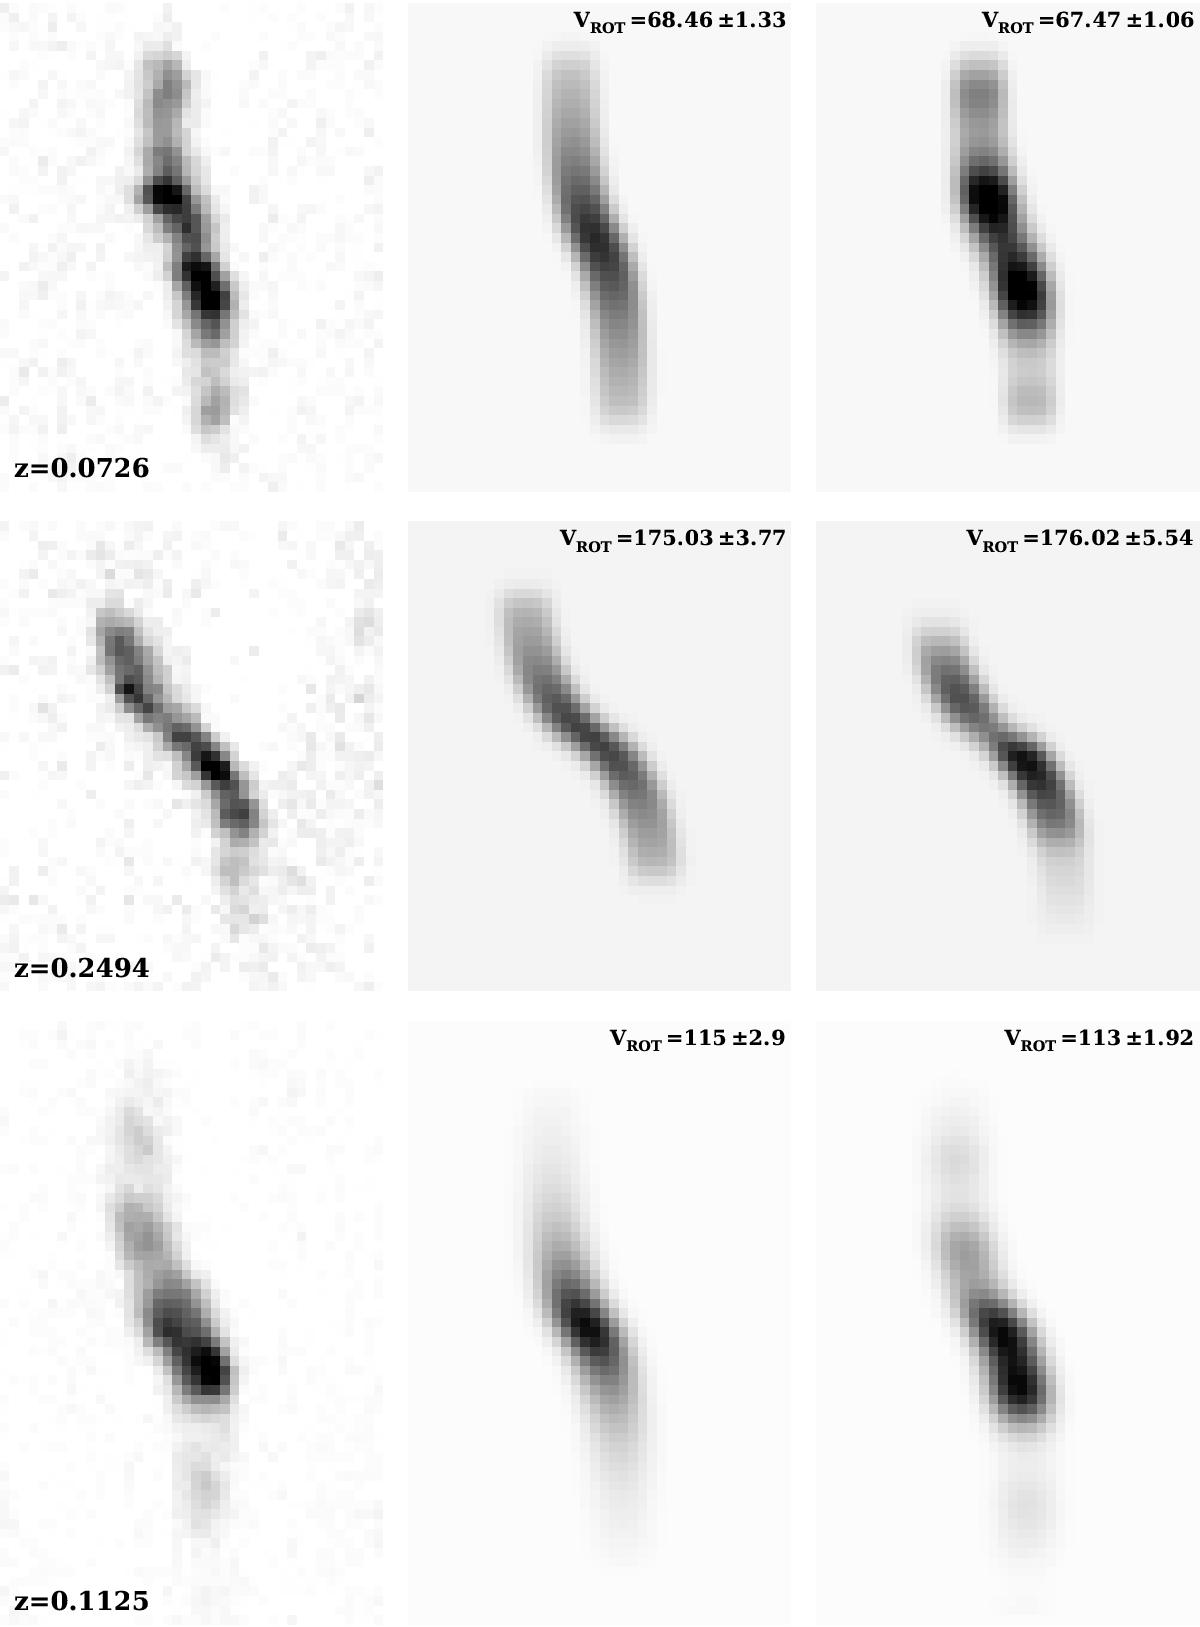
Comparison between two modeling techniques for three cases with the Hα emission line observed at z = 0.0726, z = 0.2494 and z = 0.1125. Left panels: continuum subtracted 2D spectra centered at Hα. Middle panels: best-fit models to the emission line with an exponential disc light profile. Right panels: best-fit models to the emission line with the light profile estimated from the algorithm from Scoville et al. (1983). The measurement of the velocity best-fit parameter within its uncertainties is given in the upper right corners. The images scale is: 1 pixel = 0.205″ in the spatial direction and 1 pixel = 0.6 Å in the spectral direction.
Current usage metrics show cumulative count of Article Views (full-text article views including HTML views, PDF and ePub downloads, according to the available data) and Abstracts Views on Vision4Press platform.
Data correspond to usage on the plateform after 2015. The current usage metrics is available 48-96 hours after online publication and is updated daily on week days.
Initial download of the metrics may take a while.