Fig. 10
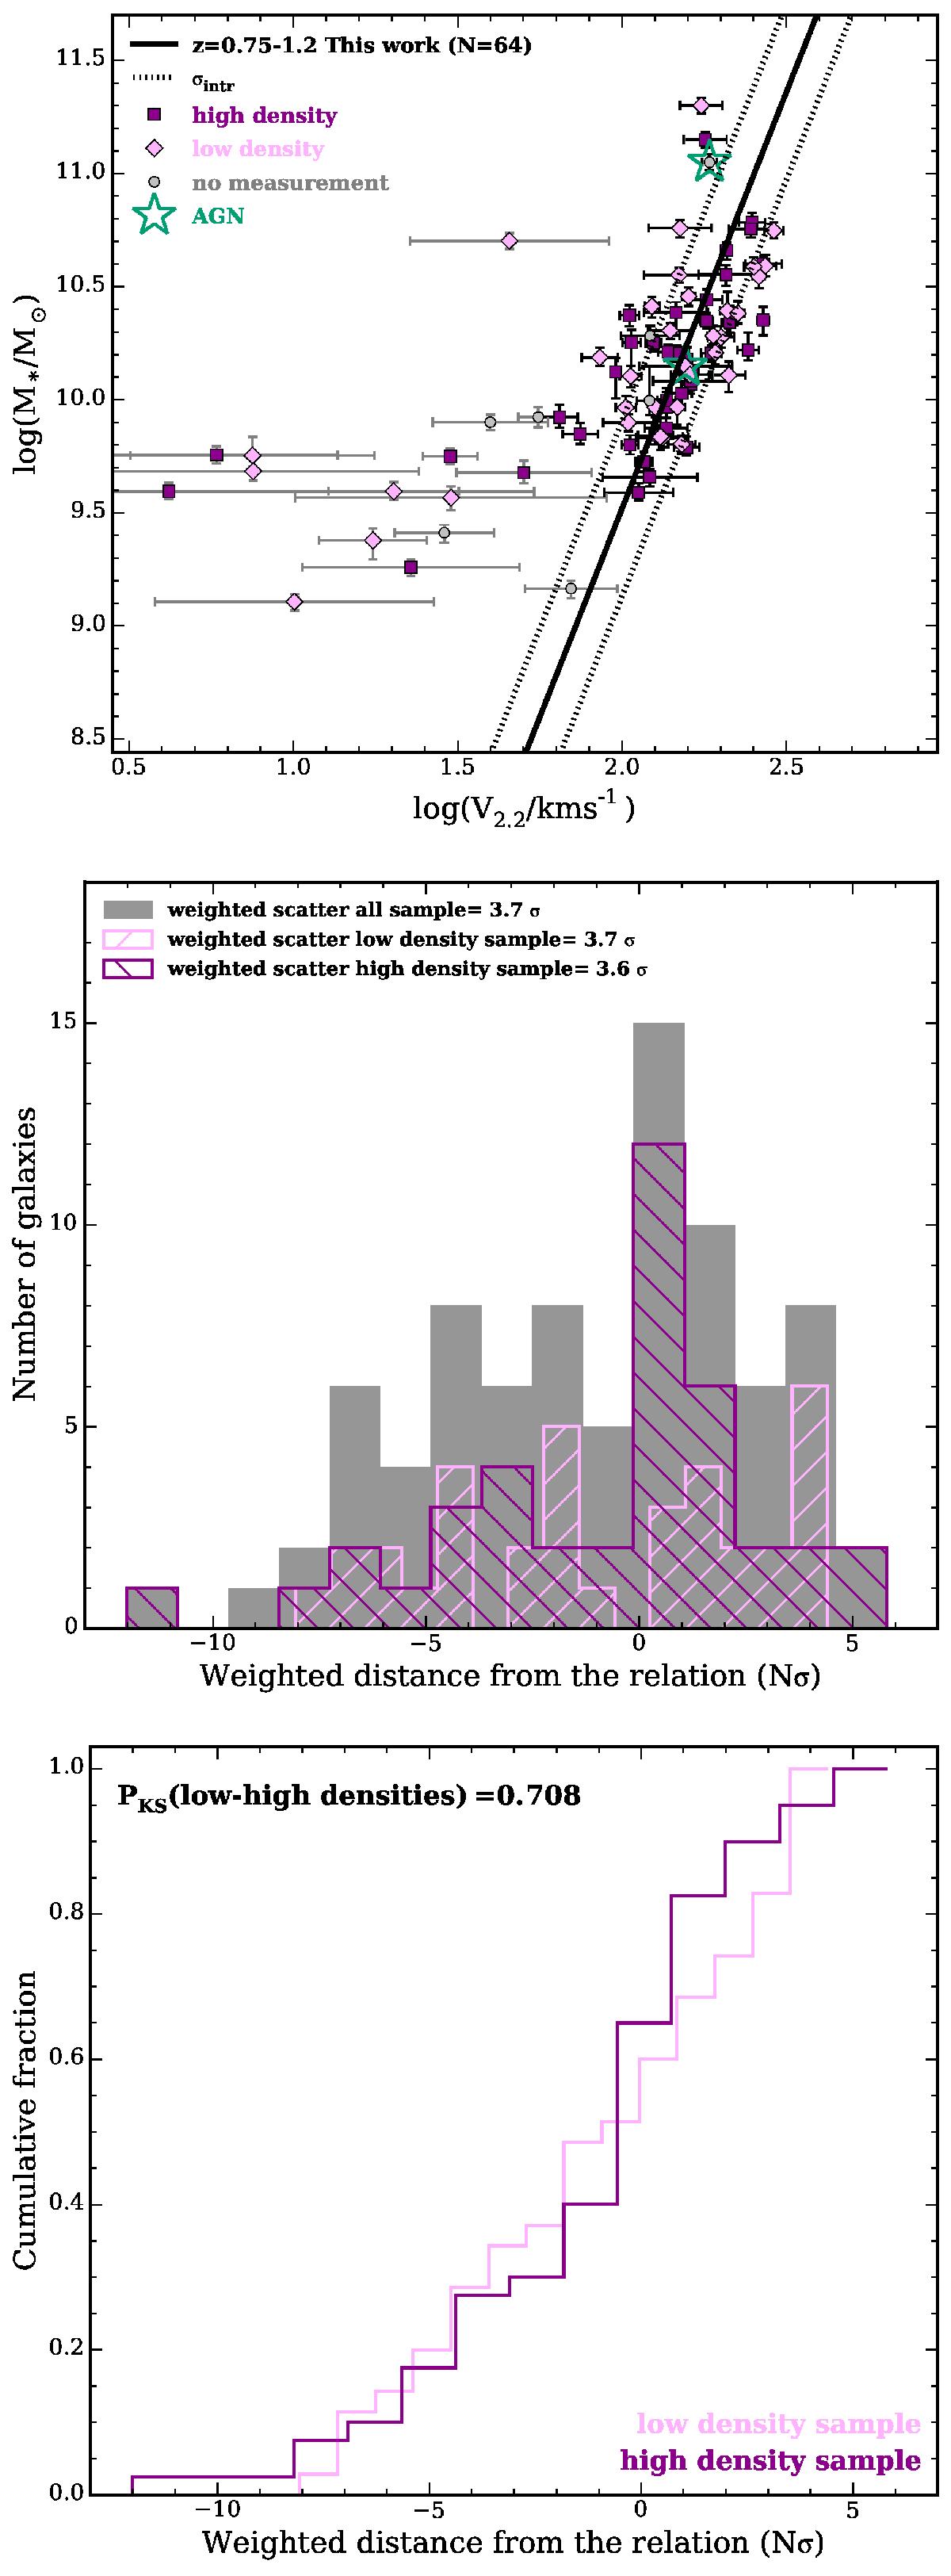
Top panel: stellar mass M∗ versus rotation velocity V2.2 for our sample at 0.75 <z< 1.2 in different environments. The pink diamonds and the purple squares are for galaxies in lower and higher density environment, respectively. The gray circles are the galaxies for which we do not have density measurements. The green stars identify the AGNs. The black solid and dotted lines show our smTF relation with the intrinsic dispersion. Middle panel: distribution of the 1σ error weighted distance dw of the data points from the relation for the entire sample in gray solid histogram, and for the galaxies in low- and high-density environments in pink and purple hashed histograms, respectively. The value of the weighted scatter around the relation for the whole sample and the two sub-samples is also shown. Bottom panel: cumulative distribution of dw for low (pink) and high (purple) density environment and the result of the K-S test.
Current usage metrics show cumulative count of Article Views (full-text article views including HTML views, PDF and ePub downloads, according to the available data) and Abstracts Views on Vision4Press platform.
Data correspond to usage on the plateform after 2015. The current usage metrics is available 48-96 hours after online publication and is updated daily on week days.
Initial download of the metrics may take a while.