Fig. 9
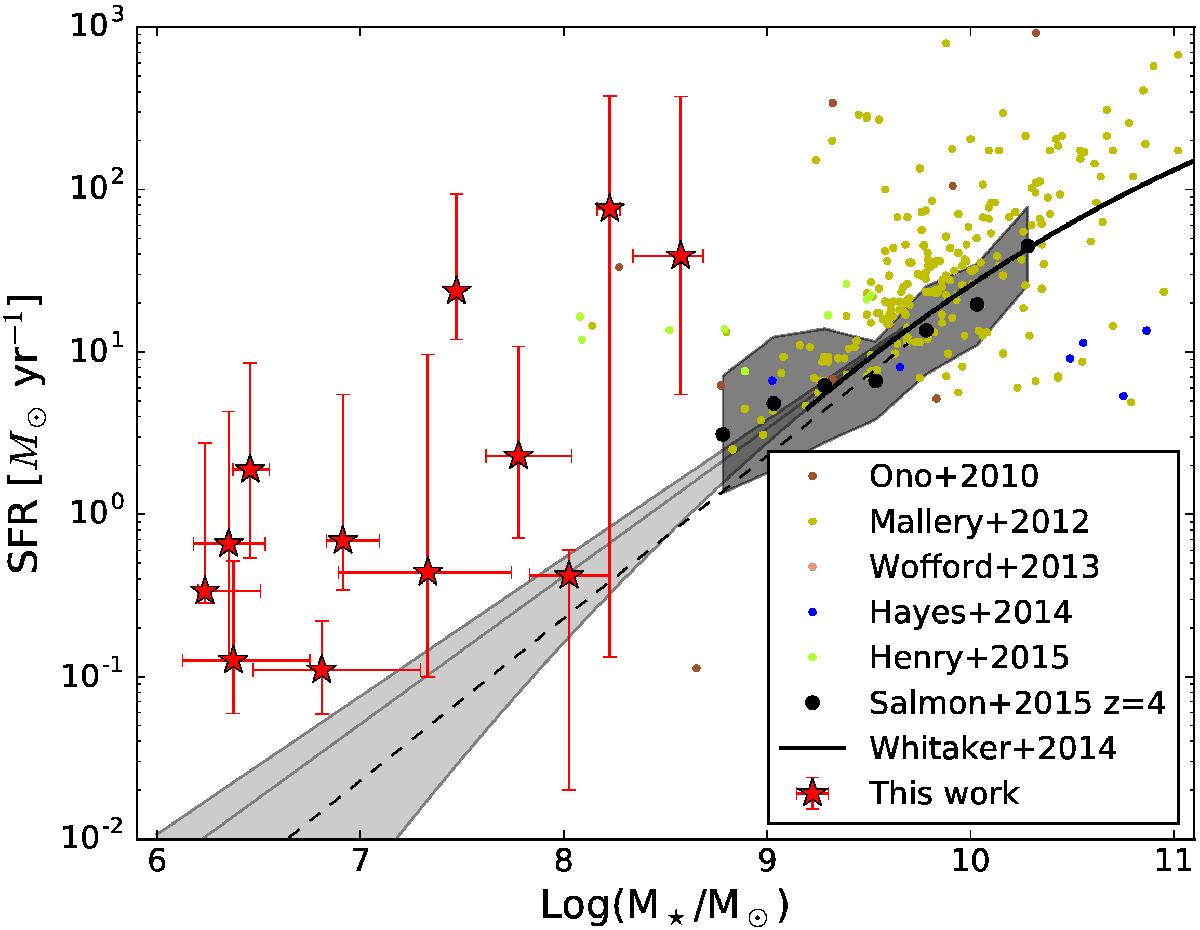
Stellar mass versus the star formation rate. See Fig. 10 for a description of the different studies. The black dots and dark grey region correspond to the SFR for galaxies in CANDELS at z ~ 4 as determined by Salmon et al. (2015), while the black dashed line presents an extrapolation to lower masses based on these data. We show the SFR for a sample of z = 2.0−2.5 galaxies from Whitaker et al. (2014) and three possible extrapolations to lower masses with the black line and three grey lines respectively.
Current usage metrics show cumulative count of Article Views (full-text article views including HTML views, PDF and ePub downloads, according to the available data) and Abstracts Views on Vision4Press platform.
Data correspond to usage on the plateform after 2015. The current usage metrics is available 48-96 hours after online publication and is updated daily on week days.
Initial download of the metrics may take a while.